Copyright
©2013 Baishideng Publishing Group Co.
World J Gastroenterol. Jun 28, 2013; 19(24): 3831-3840
Published online Jun 28, 2013. doi: 10.3748/wjg.v19.i24.3831
Published online Jun 28, 2013. doi: 10.3748/wjg.v19.i24.3831
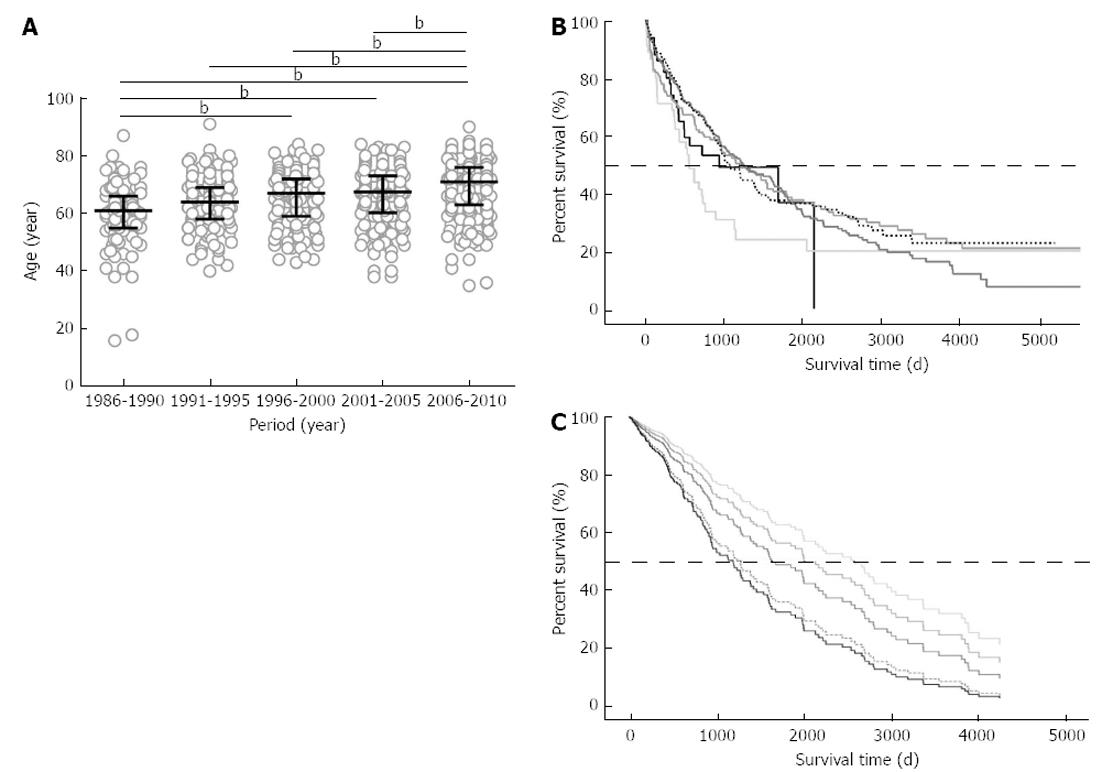
Figure 1 Age distribution in different periods and the survival of patients with hepatocellular carcinoma.
A: The age of patients who were admitted for the management of hepatocellular carcinoma was plotted for each 5-year interval since 1986: the median ages were significantly different among the different periods (P < 0.0001); B: The overall survival of 740 patients in five age groups who have already died or have been followed for longer than 1 year was calculated on the basis of Kaplan-Meier survival fractions: the median survival time of all cases was 1094 d; C: Overall survival was compared among the different age groups after compensation for background characteristics using a Cox proportional hazard model and was significantly different among age groups (P = 0.020). The solid black and dotted lines are the survival curves of the 80 years of age or older and 70-79 years of age groups, respectively. The other lines are 60-69 years of age, 50-59 years of age and 49 years of age or younger groups, indicated in colors ranging from dark to pale. bP < 0.01. The horizontal bars (A) indicate the median and interquartile range. The dotted horizontal lines (B and C) indicate a position of 50% survival.
- Citation: Suda T, Nagashima A, Takahashi S, Kanefuji T, Kamimura K, Tamura Y, Takamura M, Igarashi M, Kawai H, Yamagiwa S, Nomoto M, Aoyagi Y. Active treatments are a rational approach for hepatocellular carcinoma in elderly patients. World J Gastroenterol 2013; 19(24): 3831-3840
- URL: https://www.wjgnet.com/1007-9327/full/v19/i24/3831.htm
- DOI: https://dx.doi.org/10.3748/wjg.v19.i24.3831


