Copyright
©2013 Baishideng Publishing Group Co.
World J Gastroenterol. Jun 28, 2013; 19(24): 3747-3760
Published online Jun 28, 2013. doi: 10.3748/wjg.v19.i24.3747
Published online Jun 28, 2013. doi: 10.3748/wjg.v19.i24.3747
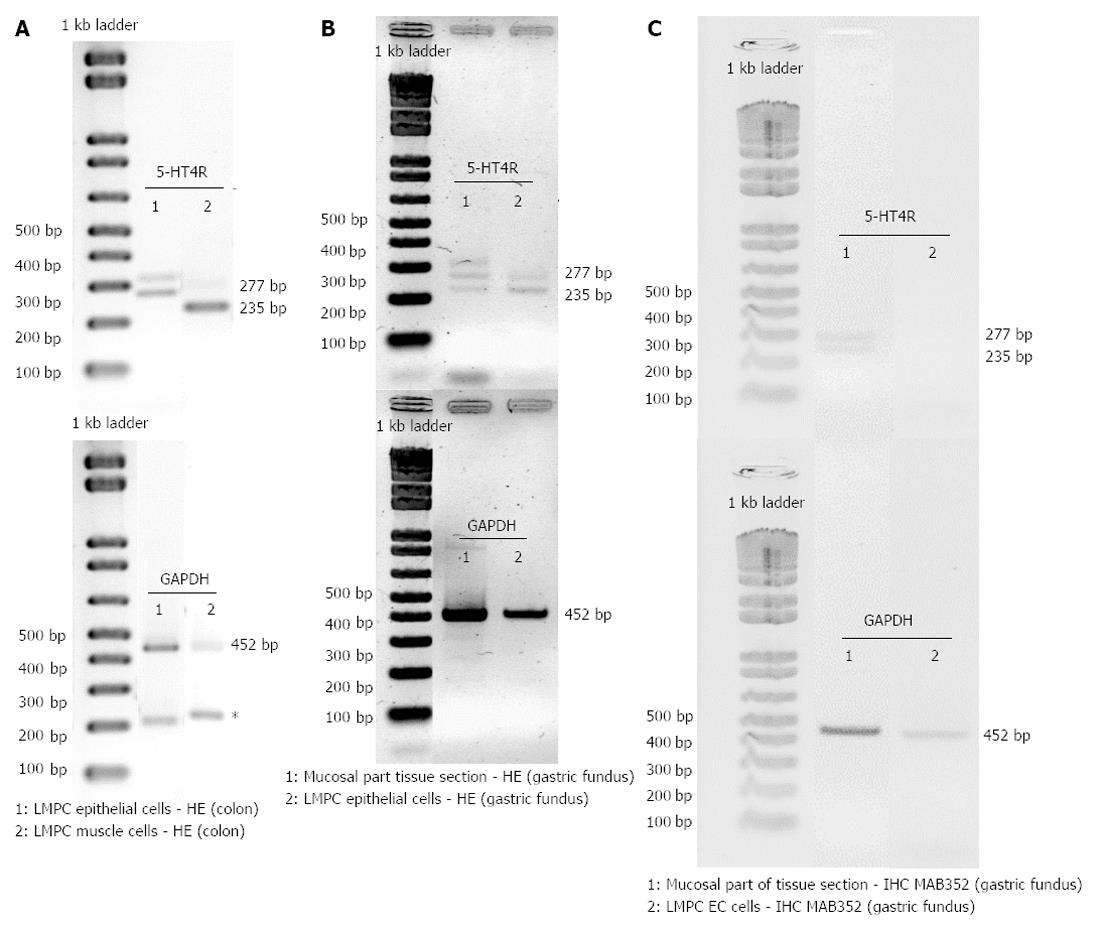
Figure 8 Invert color representation of the double round of endpoint polymerase chain reaction analysis.
A, B: 5-HT4 receptor and glyceraldehyde-3-phosphate dehydrogenase (GAPDH) expression is shown in large patches of epithelium cells and smooth muscle cells obtained by laser microdissection and pressure catapulting (LMPC) from hematoxylin and eosin (HE) stained tissue sections of colon descendens (A) and gastric fundus (B, only epithelial cells were obtained), and in enterochromaffin cells obtained by LMPC from MAB352 immunohistochemical (IHC) stained tissue sections of gastric fundus (C). For comparison, the result obtained in the mucosal part of the HE or IHC stained tissue section of gastric fundus is also shown in B and C. The size of the expected polymerase chain reaction products and presence of non-specific amplification are indicated (asterisk).
- Citation: Priem EK, Maeyer JHD, Vandewoestyne M, Deforce D, Lefebvre RA. Predominant mucosal expression of 5-HT4(+h) receptor splice variants in pig stomach and colon. World J Gastroenterol 2013; 19(24): 3747-3760
- URL: https://www.wjgnet.com/1007-9327/full/v19/i24/3747.htm
- DOI: https://dx.doi.org/10.3748/wjg.v19.i24.3747


