Copyright
©2013 Baishideng Publishing Group Co.
World J Gastroenterol. Jun 28, 2013; 19(24): 3747-3760
Published online Jun 28, 2013. doi: 10.3748/wjg.v19.i24.3747
Published online Jun 28, 2013. doi: 10.3748/wjg.v19.i24.3747
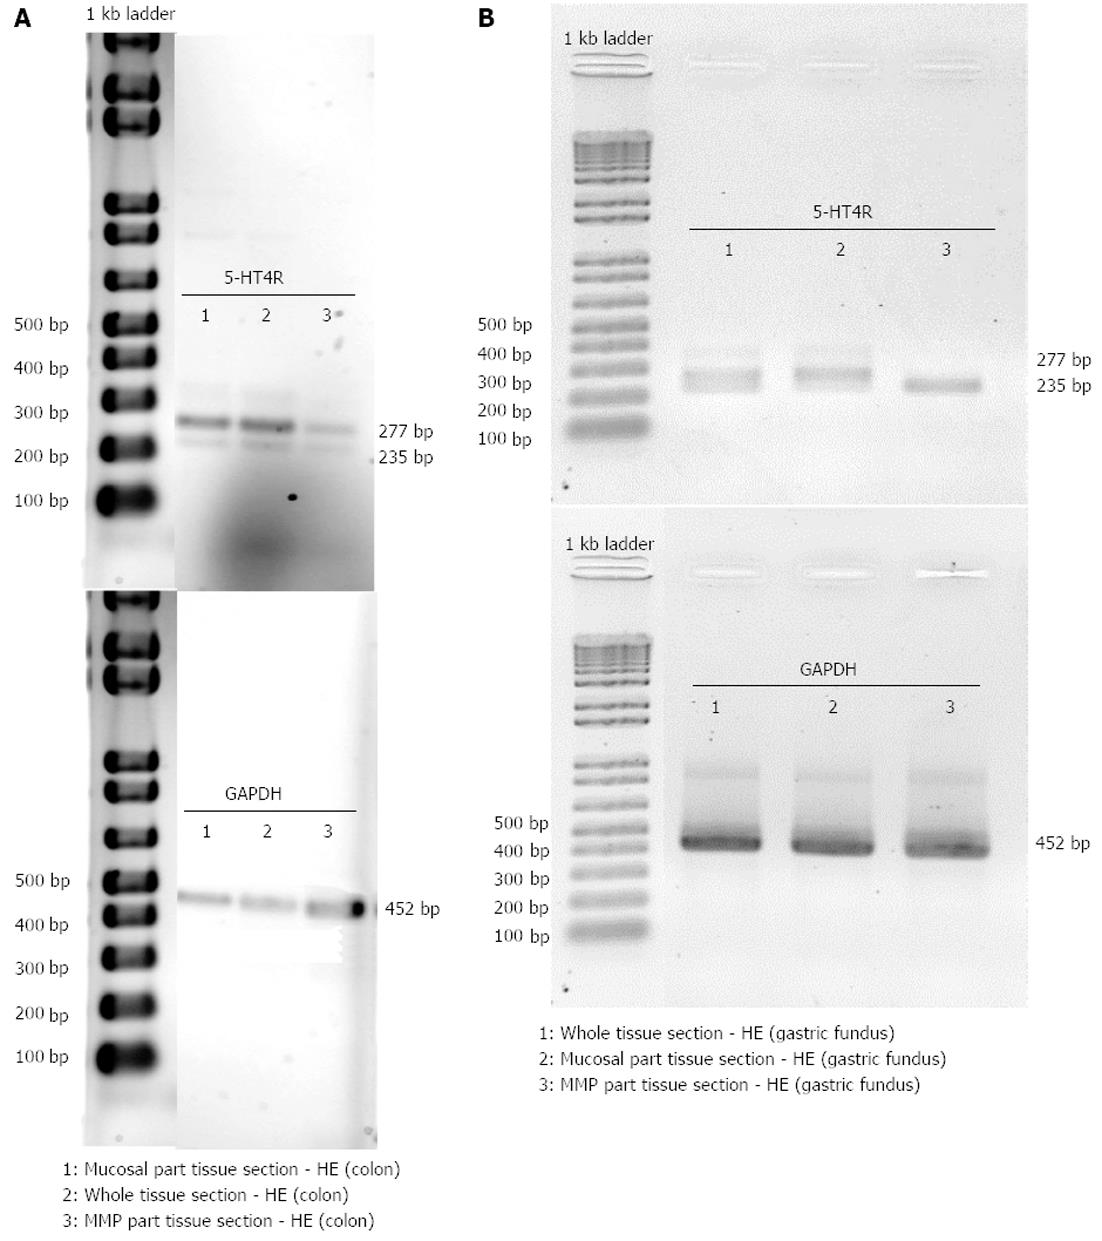
Figure 7 Invert color image of endpoint polymerase chain reaction analysis.
5-HT4 receptor and glyceraldehyde-3-phosphate dehydrogenase (GAPDH) expression is shown in a hematoxylin and eosin (HE) stained whole tissue section, and in the mucosal as well as the muscle-myenteric plexus (MMP) part of a HE stained tissue section of colon descendens (A) and gastric fundus (B). The size of the expected polymerase chain reaction products is indicated.
- Citation: Priem EK, Maeyer JHD, Vandewoestyne M, Deforce D, Lefebvre RA. Predominant mucosal expression of 5-HT4(+h) receptor splice variants in pig stomach and colon. World J Gastroenterol 2013; 19(24): 3747-3760
- URL: https://www.wjgnet.com/1007-9327/full/v19/i24/3747.htm
- DOI: https://dx.doi.org/10.3748/wjg.v19.i24.3747


