Copyright
©2013 Baishideng Publishing Group Co.
World J Gastroenterol. Jun 21, 2013; 19(23): 3634-3641
Published online Jun 21, 2013. doi: 10.3748/wjg.v19.i23.3634
Published online Jun 21, 2013. doi: 10.3748/wjg.v19.i23.3634
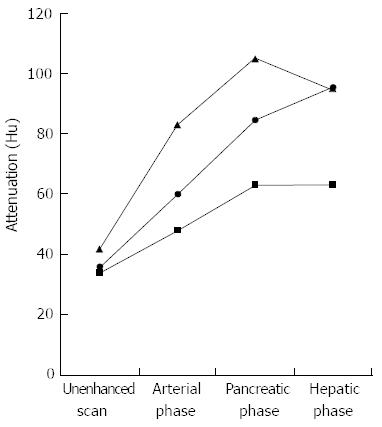
Figure 5 Graph shows mean computed tomography attenuation values of normal pancreatic parenchyma (triangle) and lesions in patients with focal autoimmune pancreatitis (circle) and pancreatic cancer (square) in relation to phase of contrast enhancement.
- Citation: Sun GF, Zuo CJ, Shao CW, Wang JH, Zhang J. Focal autoimmune pancreatitis: Radiological characteristics help to distinguish from pancreatic cancer. World J Gastroenterol 2013; 19(23): 3634-3641
- URL: https://www.wjgnet.com/1007-9327/full/v19/i23/3634.htm
- DOI: https://dx.doi.org/10.3748/wjg.v19.i23.3634


