Copyright
©2013 Baishideng Publishing Group Co.
World J Gastroenterol. Jun 21, 2013; 19(23): 3615-3622
Published online Jun 21, 2013. doi: 10.3748/wjg.v19.i23.3615
Published online Jun 21, 2013. doi: 10.3748/wjg.v19.i23.3615
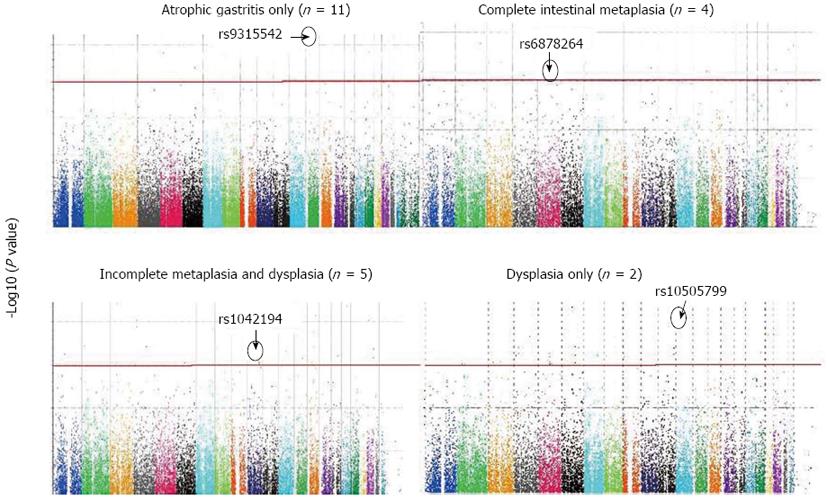
Figure 1 Manhattan plots for different gastric precancerous lesions (phenotype) in susceptible Malays with Helicobacter pylori.
Red line indicates genomic threshold (3 × 10⁻⁷) set to determine single nucleotide polymorphisms (SNPs) in Hardy-Weinberg Equilibrium associated with the studied phenotype. The most significant SNP, as determined by the χ2P value, for each phenotype is shown by an arrow.
-
Citation: Maran S, Lee YY, Xu S, Rajab NS, Hasan N, Syed Abdul Aziz SH, Majid NA, Zilfalil BA. Gastric precancerous lesions are associated with gene variants in
Helicobacter pylori -susceptible ethnic Malays. World J Gastroenterol 2013; 19(23): 3615-3622 - URL: https://www.wjgnet.com/1007-9327/full/v19/i23/3615.htm
- DOI: https://dx.doi.org/10.3748/wjg.v19.i23.3615


