Copyright
©2013 Baishideng Publishing Group Co.
World J Gastroenterol. Jun 14, 2013; 19(22): 3423-3432
Published online Jun 14, 2013. doi: 10.3748/wjg.v19.i22.3423
Published online Jun 14, 2013. doi: 10.3748/wjg.v19.i22.3423
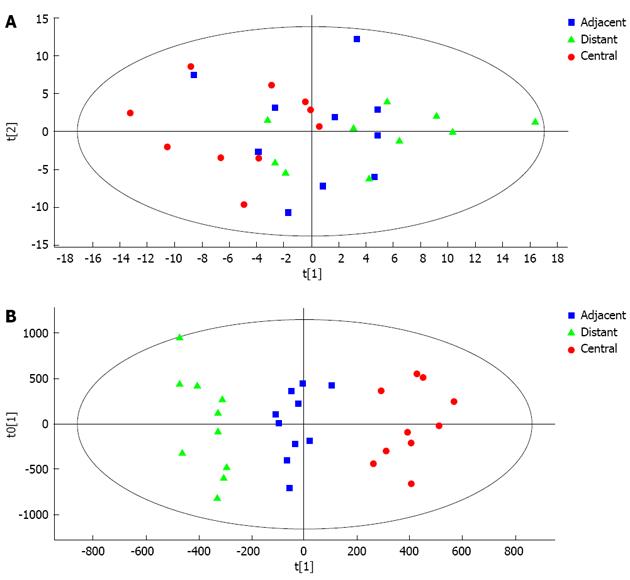
Figure 4 Ability of metabolic profiling to distinguish disease in tissue samples.
A: Score plot of the first two components [t(1)/t(2)] of the tissue metabolic profiling principal component analysis model; B: Score plot of metabolic profiling orthogonal partial least squares discriminant analysis model. Each point in the figure represents a sample. Distant: Distant tissue group; Adjacent: Adjacent tissue group; Central: Central tumor tissue group.
- Citation: Liu SY, Zhang RL, Kang H, Fan ZJ, Du Z. Human liver tissue metabolic profiling research on hepatitis B virus-related hepatocellular carcinoma. World J Gastroenterol 2013; 19(22): 3423-3432
- URL: https://www.wjgnet.com/1007-9327/full/v19/i22/3423.htm
- DOI: https://dx.doi.org/10.3748/wjg.v19.i22.3423


