Copyright
©2013 Baishideng Publishing Group Co.
World J Gastroenterol. Jun 7, 2013; 19(21): 3339-3346
Published online Jun 7, 2013. doi: 10.3748/wjg.v19.i21.3339
Published online Jun 7, 2013. doi: 10.3748/wjg.v19.i21.3339
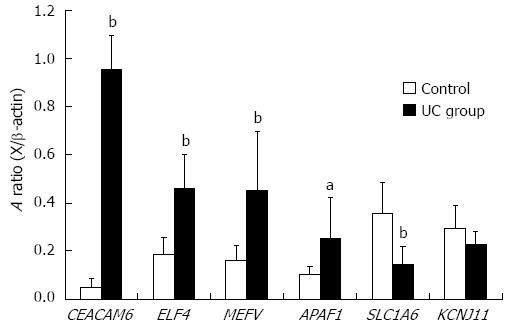
Figure 2 Semiquantitative relative reverse transcription-polymerase chain reaction validation of 6 selected genes.
The values were normalized against β-actin. Graph bars indicate the averaged absorbance (A) ratios between each gene and β-actin. Values represent the mean ± SE. Significance levels were: aP < 0.05, bP < 0.01 vs control subjects. UC: Ulcerative colitis.
- Citation: Miao YL, Xiao YL, Du Y, Duan LP. Gene expression profiles in peripheral blood mononuclear cells of ulcerative colitis patients. World J Gastroenterol 2013; 19(21): 3339-3346
- URL: https://www.wjgnet.com/1007-9327/full/v19/i21/3339.htm
- DOI: https://dx.doi.org/10.3748/wjg.v19.i21.3339


