Copyright
©2013 Baishideng Publishing Group Co.
World J Gastroenterol. Jun 7, 2013; 19(21): 3173-3188
Published online Jun 7, 2013. doi: 10.3748/wjg.v19.i21.3173
Published online Jun 7, 2013. doi: 10.3748/wjg.v19.i21.3173
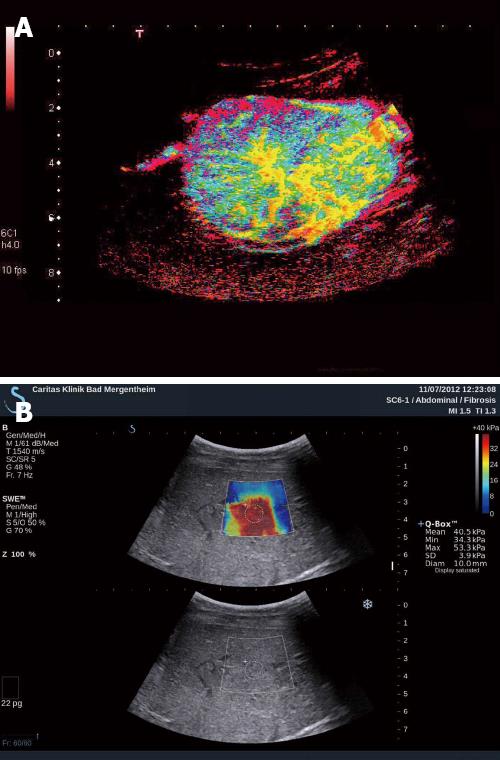
Figure 4 Focal nodular hyperplasia.
A: In addition to conventional contrast-enhanced ultrasound (CEUS), parametric CEUS displays also the timeline of contrast enhancement (early enhancement in yellow, later enhancement in blue); B: Histologically proven. B-mode revealed isoechoic lesion, very difficult to identify. Shear wave elastography reveals very hard tissue of the lesion, shown in red in comparison to the surrounding soft liver parenchyma.
- Citation: Dietrich CF, Sharma M, Gibson RN, Schreiber-Dietrich D, Jenssen C. Fortuitously discovered liver lesions. World J Gastroenterol 2013; 19(21): 3173-3188
- URL: https://www.wjgnet.com/1007-9327/full/v19/i21/3173.htm
- DOI: https://dx.doi.org/10.3748/wjg.v19.i21.3173


