Copyright
©2013 Baishideng Publishing Group Co.
World J Gastroenterol. May 21, 2013; 19(19): 2921-2934
Published online May 21, 2013. doi: 10.3748/wjg.v19.i19.2921
Published online May 21, 2013. doi: 10.3748/wjg.v19.i19.2921
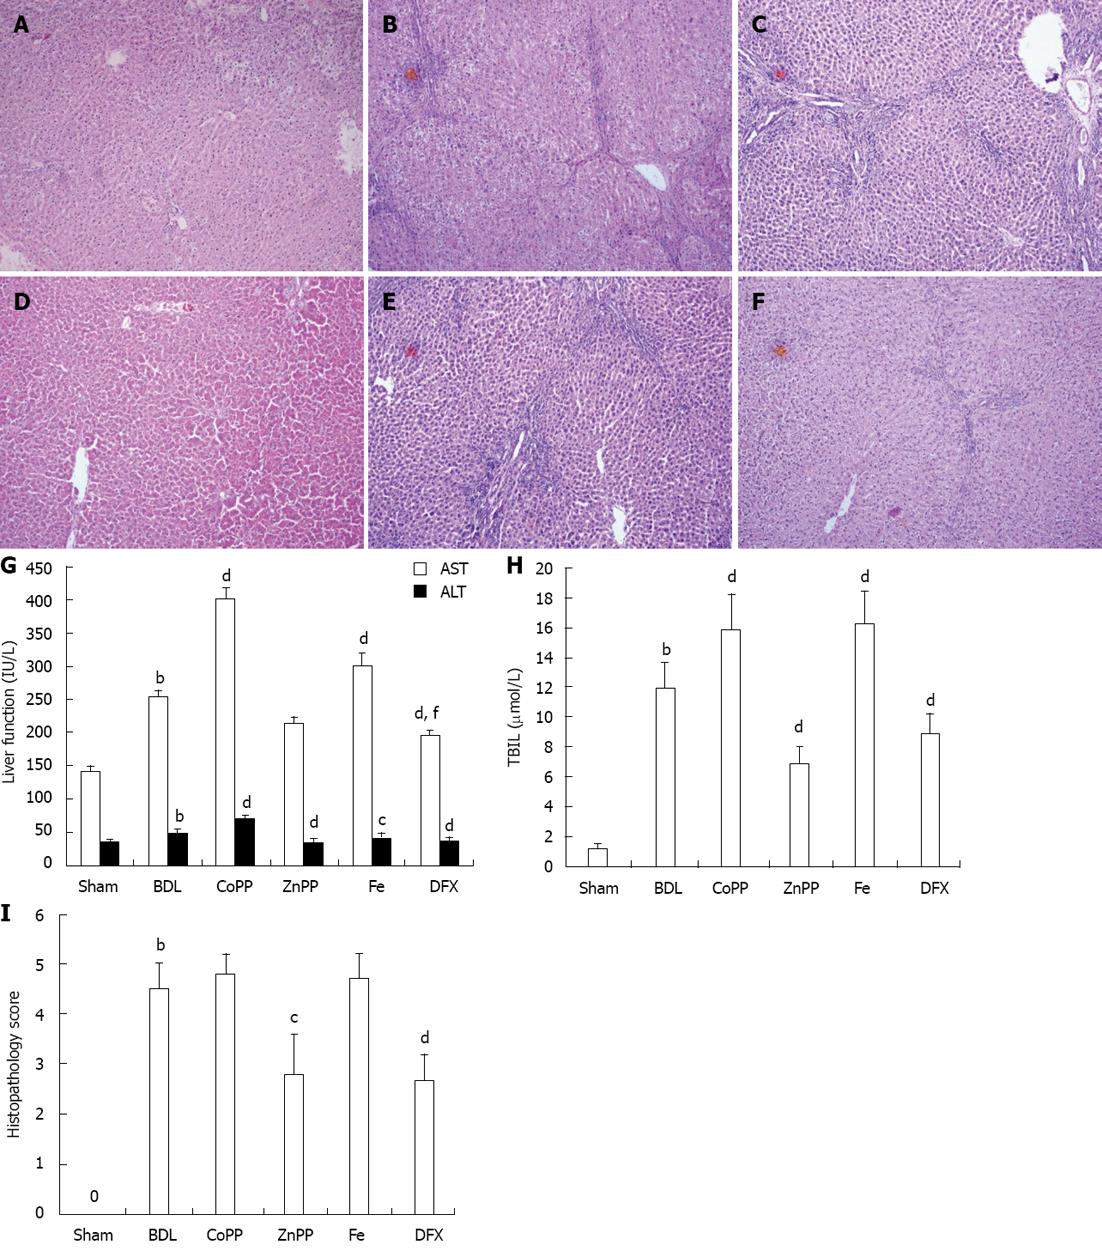
Figure 1 Pathological features of rat liver tissue detected by hematoxylin and eosin staining and serum index.
A: Normal lobular architecture in the Sham group; B, C, E: Obvious fibrous hyperplasia and fibrosis extension with fibroblast proliferation in the bile duct ligation (BDL) group, cobalt protoporphyrin (CoPP) group and Fe group; D and F: Less fibrous hyperplasia and fibrosis in the zinc protoporphyrin (ZnPP) group and deferoxamine (DFX) group; G, H: Levels of aspartate aminotransferase (AST), alanine aminotransferase (ALT) and total bilirubin (TBIL); I: Histopathological scores for fibrosis (magnification × 100). Values are expressed as mean ± SE (n = 6). bP < 0.01 vs Sham group; cP < 0.05, dP < 0.01 vs BDL group; fP < 0.01 vs ZnPP group.
- Citation: Wang QM, Du JL, Duan ZJ, Guo SB, Sun XY, Liu Z. Inhibiting heme oxygenase-1 attenuates rat liver fibrosis by removing iron accumulation. World J Gastroenterol 2013; 19(19): 2921-2934
- URL: https://www.wjgnet.com/1007-9327/full/v19/i19/2921.htm
- DOI: https://dx.doi.org/10.3748/wjg.v19.i19.2921


