Copyright
©2013 Baishideng Publishing Group Co.
World J Gastroenterol. Apr 28, 2013; 19(16): 2481-2491
Published online Apr 28, 2013. doi: 10.3748/wjg.v19.i16.2481
Published online Apr 28, 2013. doi: 10.3748/wjg.v19.i16.2481
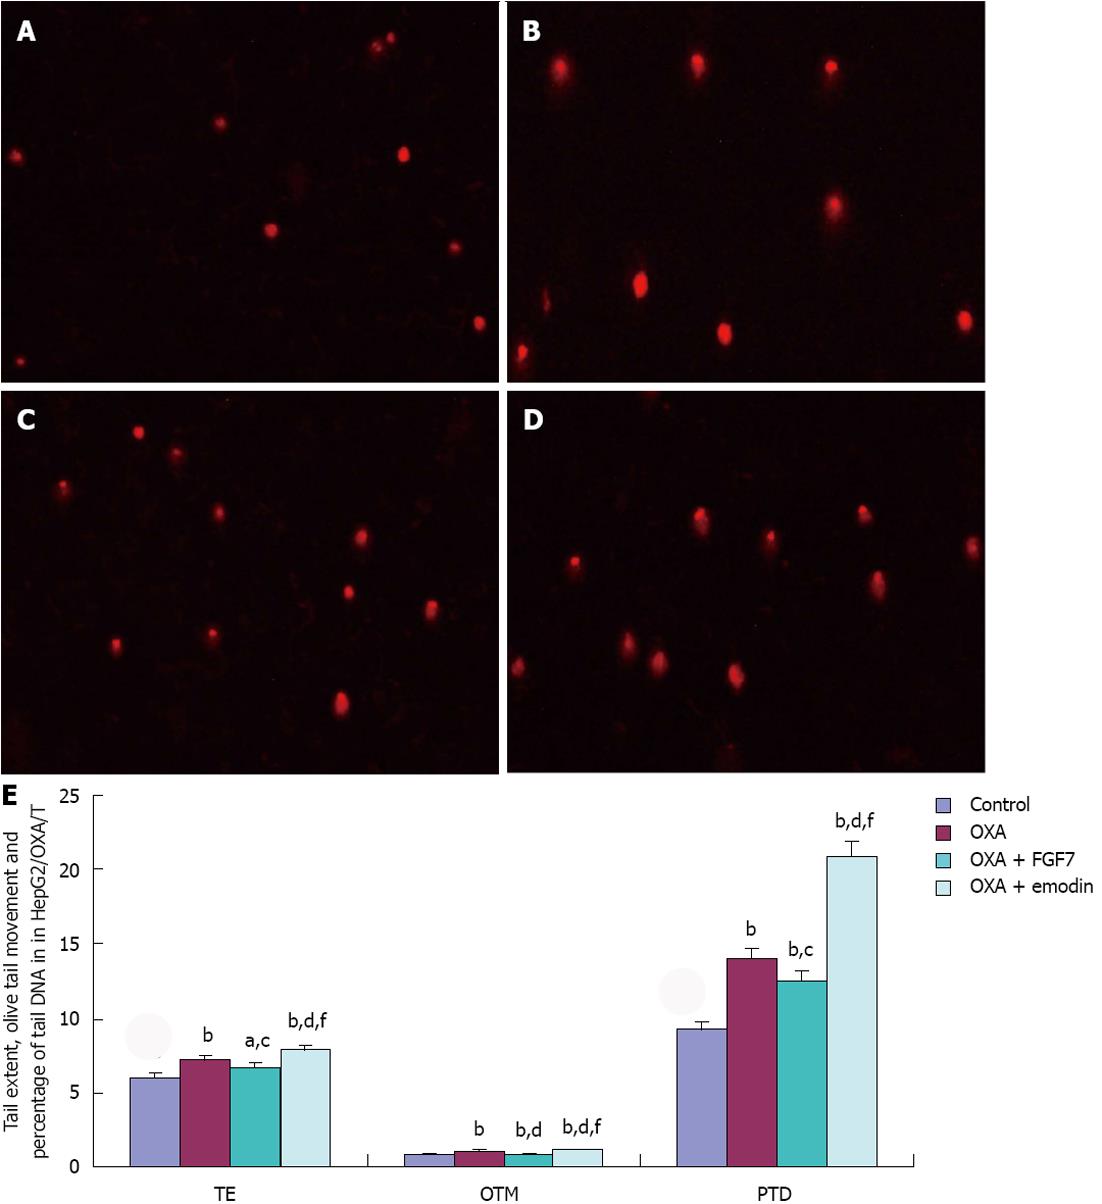
Figure 4 DNA damage detected by single cell gel electrophoresis in HepG2/oxaliplatin/T.
A-D: Ethidium bromide stain (magnification × 200). Control group (A), Oxaliplatin (OXA) group (B), OXA + fibroblast growth factor 7 (FGF7) group (C), OXA + emodin group (D); E: The tail extent (TE), the Olive tail moment (OTM) and the percentage of tail DNA (PTD) were considerably increased in the OXA + emodin group in comparison with the OXA group and the OXA + FGF7 group, respectively, and these differences were statistically significant. TE, OTM and PTD were significantly decreased in the OXA + FGF7 group in comparison to those in the OXA group and the OXA + FGF7 group, but were greater than those in the control group (aP < 0.05, bP < 0.01 vs control group; cP < 0.05, dP < 0.01 vs OXA group; fP < 0.01 vs OXA + FGF7 group).
- Citation: Chen G, Qiu H, Ke SD, Hu SM, Yu SY, Zou SQ. Emodin regulating excision repair cross-complementation group 1 through fibroblast growth factor receptor 2 signaling. World J Gastroenterol 2013; 19(16): 2481-2491
- URL: https://www.wjgnet.com/1007-9327/full/v19/i16/2481.htm
- DOI: https://dx.doi.org/10.3748/wjg.v19.i16.2481


