Copyright
©2013 Baishideng Publishing Group Co.
World J Gastroenterol. Apr 14, 2013; 19(14): 2179-2186
Published online Apr 14, 2013. doi: 10.3748/wjg.v19.i14.2179
Published online Apr 14, 2013. doi: 10.3748/wjg.v19.i14.2179
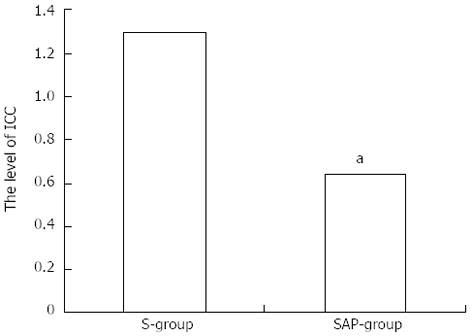
Figure 4 Mean optical density of c-kit mRNA.
Each bar represents the mean ± SD (vertical line). aP < 0.05 vs sham (S) group. ICC: Interstitial cells of Cajal.
- Citation: Shi LL, Liu MD, Chen M, Zou XP. Involvement of interstitial cells of Cajal in experimental severe acute pancreatitis in rats. World J Gastroenterol 2013; 19(14): 2179-2186
- URL: https://www.wjgnet.com/1007-9327/full/v19/i14/2179.htm
- DOI: https://dx.doi.org/10.3748/wjg.v19.i14.2179


