Copyright
©2013 Baishideng Publishing Group Co.
World J Gastroenterol. Mar 14, 2013; 19(10): 1593-1601
Published online Mar 14, 2013. doi: 10.3748/wjg.v19.i10.1593
Published online Mar 14, 2013. doi: 10.3748/wjg.v19.i10.1593
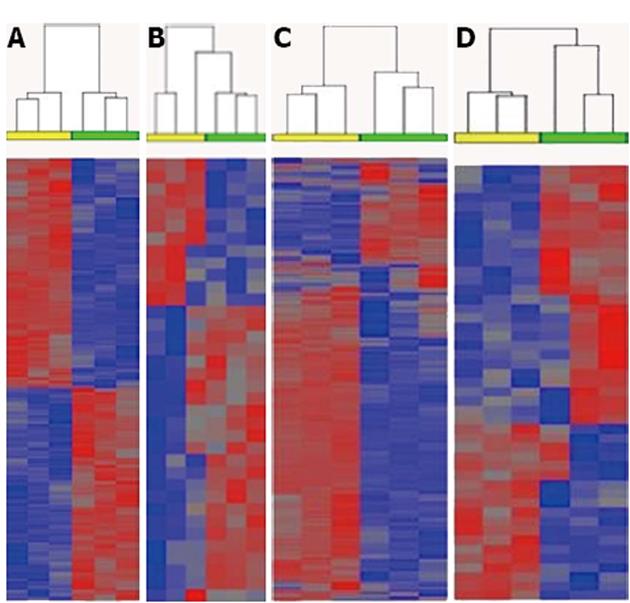
Figure 1 Heat maps with hierarchical clustering of mRNAs (A, C) and microRNAs (B, D) in Huh-7 cells exposed to heme, 10 μmol/L (yellow bars, left side of each panel) or 4, 6-dioxoheptanoic acid, 500 μmol/L (green bars, right side of each panel).
A and B: The duration of exposure to heme or DHA was 6 h; C and D: The duration of exposure was 24 h. Cells were cultured, treated, harvested, and RNA arrays performed and analyzed as described in Materials and Methods. Blue color indicates decreased expression; red color indicates increased expression.
- Citation: Bonkovsky HL, Hou W, Steuerwald N, Tian Q, Li T, Parsons J, Hamilton A, Hwang S, Schrum L. Heme status affects human hepatic messenger RNA and microRNA expression. World J Gastroenterol 2013; 19(10): 1593-1601
- URL: https://www.wjgnet.com/1007-9327/full/v19/i10/1593.htm
- DOI: https://dx.doi.org/10.3748/wjg.v19.i10.1593


