Copyright
©2013 Baishideng Publishing Group Co.
World J Gastroenterol. Mar 14, 2013; 19(10): 1563-1571
Published online Mar 14, 2013. doi: 10.3748/wjg.v19.i10.1563
Published online Mar 14, 2013. doi: 10.3748/wjg.v19.i10.1563
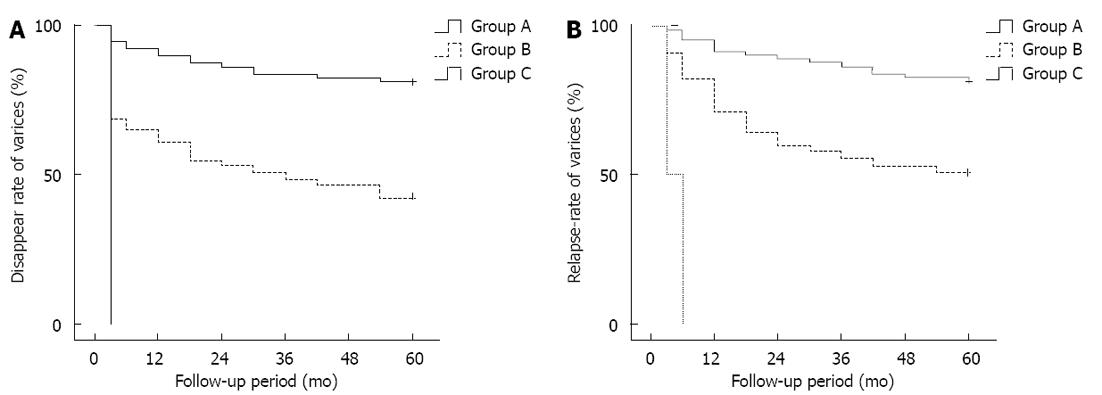
Figure 5 Kaplan-Meier analysis of the disappearance rate (A) and non-relapse rate (B) of varices shown at gastroscopy during the follow-up.
Group A: Complete obliteration; Group B: Partial obliteration; Group C: Trunk obliteration.
- Citation: Sun A, Shi YJ, Xu ZD, Tian XG, Hu JH, Wang GC, Zhang CQ. MDCT angiography to evaluate the therapeutic effect of PTVE for esophageal varices. World J Gastroenterol 2013; 19(10): 1563-1571
- URL: https://www.wjgnet.com/1007-9327/full/v19/i10/1563.htm
- DOI: https://dx.doi.org/10.3748/wjg.v19.i10.1563


