Copyright
©2013 Baishideng Publishing Group Co.
World J Gastroenterol. Jan 7, 2013; 19(1): 57-64
Published online Jan 7, 2013. doi: 10.3748/wjg.v19.i1.57
Published online Jan 7, 2013. doi: 10.3748/wjg.v19.i1.57
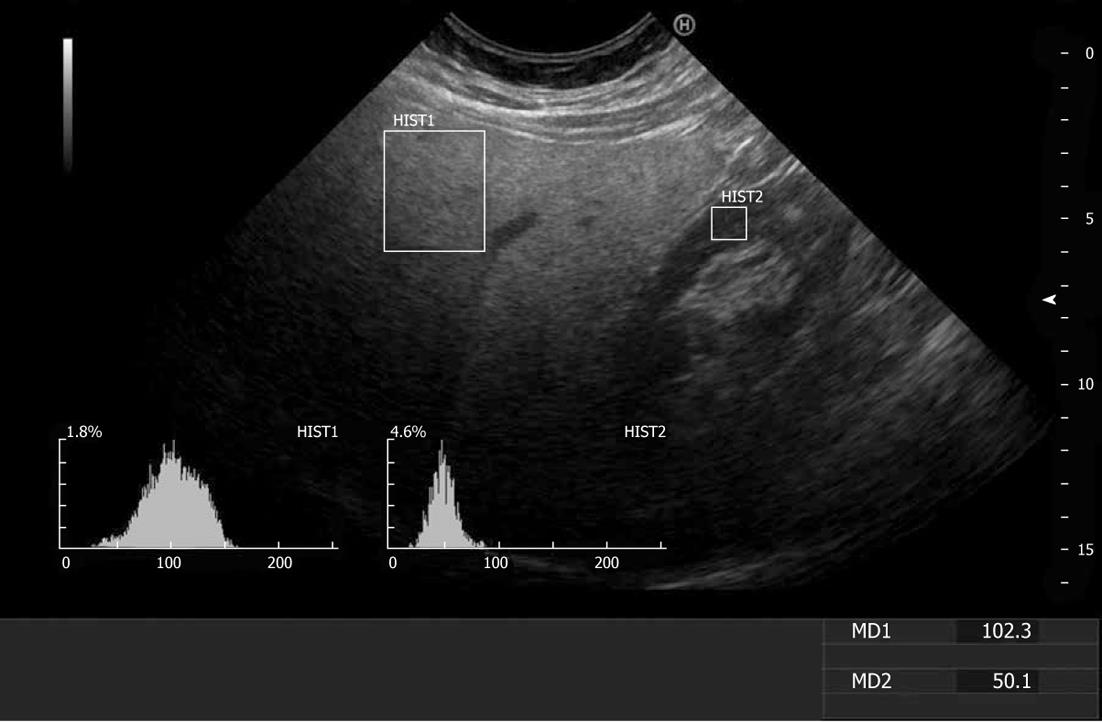
Figure 1 Ultrasound image of the liver and the right kidney cortex with graphic representation of the histogram in the region of interest rectangle.
HIST1 is the histogram of the liver and HIST2 is the histogram of the right kidney cortex. The median histogram (MD) 1 of the liver is 102.3 and the MD2 of the kidney cortex is 50.1, yielding an HRI of 2.04.
- Citation: Zelber-Sagi S, Webb M, Assy N, Blendis L, Yeshua H, Leshno M, Ratziu V, Halpern Z, Oren R, Santo E. Comparison of fatty liver index with noninvasive methods for steatosis detection and quantification. World J Gastroenterol 2013; 19(1): 57-64
- URL: https://www.wjgnet.com/1007-9327/full/v19/i1/57.htm
- DOI: https://dx.doi.org/10.3748/wjg.v19.i1.57


