Copyright
©2012 Baishideng Publishing Group Co.
World J Gastroenterol. Feb 28, 2012; 18(8): 821-832
Published online Feb 28, 2012. doi: 10.3748/wjg.v18.i8.821
Published online Feb 28, 2012. doi: 10.3748/wjg.v18.i8.821
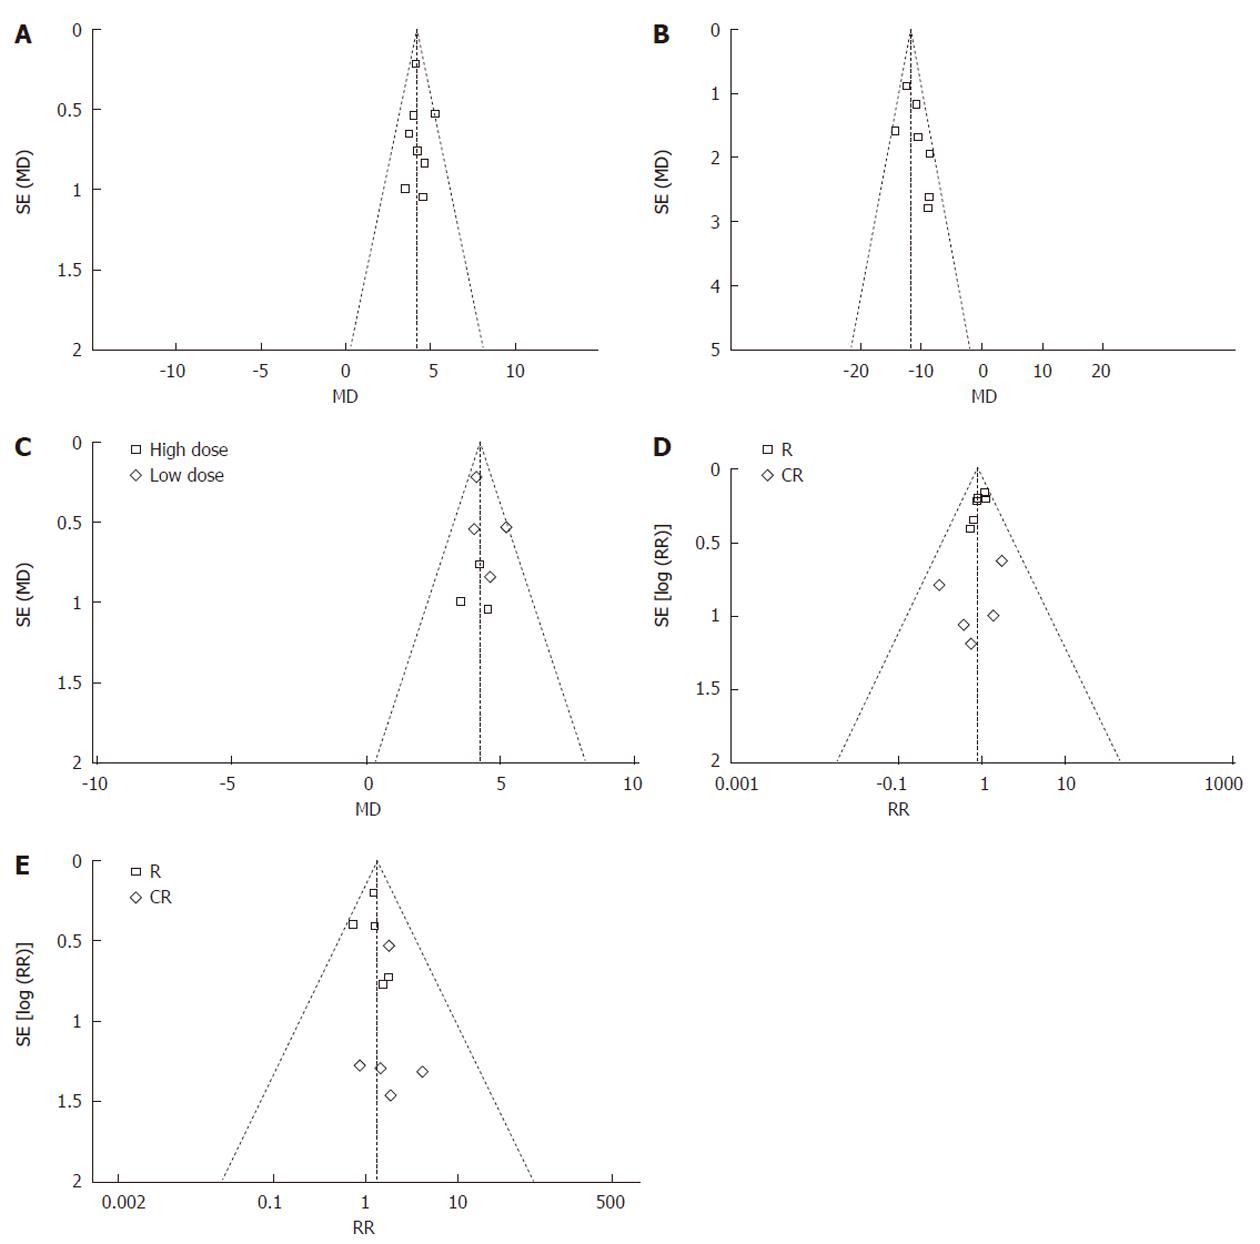
Figure 13 Publication bias analysis.
A: Funnel plots of proteinuria treatment with steroid combination therapy; B: Funnel plots of serum albumin change with steroid combination therapy; C: Funnel plots of proteinuria change under different combined glucorticosteroids drugs; D: Funnel plots of remission rate vs complete remission rate of MN and MsPGN groups; E: Funnel plots of remission rate vs complete remission rate of MN and MsPGN groups. MN: Membranous glomerulonephritis; MsPGN: Mesangial proliferative glomemlonephrits; R: Remission; CR: Complete remission; RR: Relative risk; MD: Mean difference.
- Citation: Zheng XY, Wei RB, Tang L, Li P, Zheng XD. Meta-analysis of combined therapy for adult hepatitis B virus-associated glomerulonephritis. World J Gastroenterol 2012; 18(8): 821-832
- URL: https://www.wjgnet.com/1007-9327/full/v18/i8/821.htm
- DOI: https://dx.doi.org/10.3748/wjg.v18.i8.821


