Copyright
©2012 Baishideng Publishing Group Co.
World J Gastroenterol. Feb 28, 2012; 18(8): 746-753
Published online Feb 28, 2012. doi: 10.3748/wjg.v18.i8.746
Published online Feb 28, 2012. doi: 10.3748/wjg.v18.i8.746
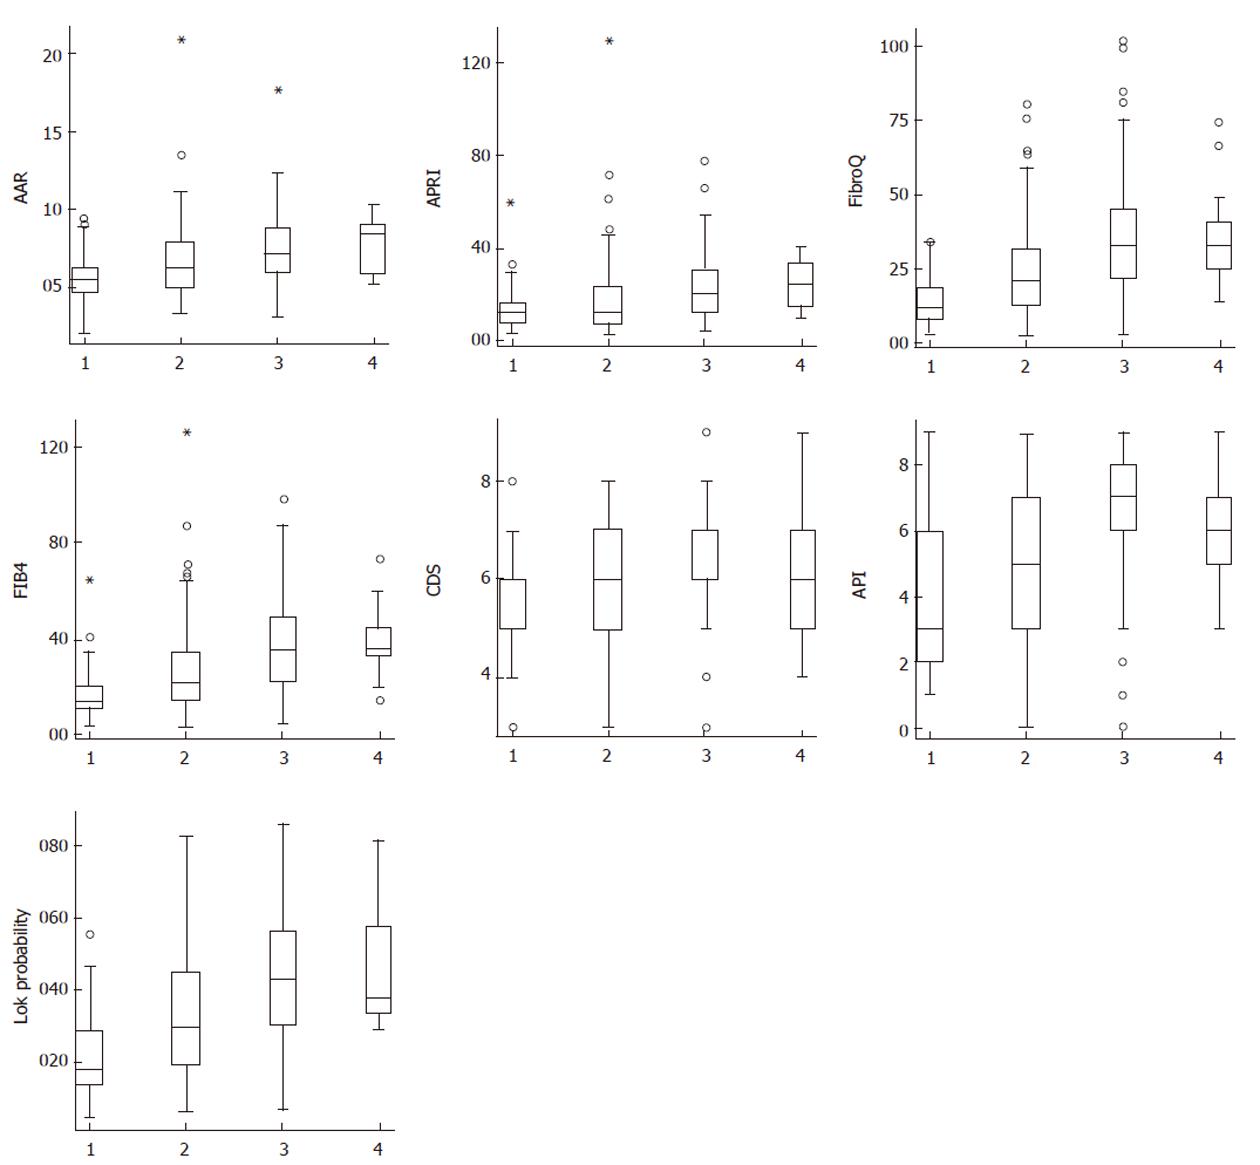
Figure 1 Score values according to Metavir fibrosis stages.
Each outlier value is represented by a small circle symbol (o) in the Box Plot graph. If an outlier is more than 3 times the inter-quartile range away from Q1 or Q3, it is classified as an extreme outlier, asterisk sign (*). The top and bottom of each box are the 25th and the 75th percentiles. The line through the box is the median, and the errors bars are the 5th and 95th percentiles. AAR: AST/ALT ratio; APRI: AST-to-platelet ratio index; AST: Aspartate aminotransferase; ALT: Alanine aminotransferase; API: Age-platelet index; CDS: Cirrhosis discriminant score.
- Citation: Hsieh YY, Tung SY, Lee K, Wu CS, Wei KL, Shen CH, Chang TS, Lin YH. Routine blood tests to predict liver fibrosis in chronic hepatitis C. World J Gastroenterol 2012; 18(8): 746-753
- URL: https://www.wjgnet.com/1007-9327/full/v18/i8/746.htm
- DOI: https://dx.doi.org/10.3748/wjg.v18.i8.746


