Copyright
©2012 Baishideng Publishing Group Co.
World J Gastroenterol. Dec 28, 2012; 18(48): 7212-7224
Published online Dec 28, 2012. doi: 10.3748/wjg.v18.i48.7212
Published online Dec 28, 2012. doi: 10.3748/wjg.v18.i48.7212
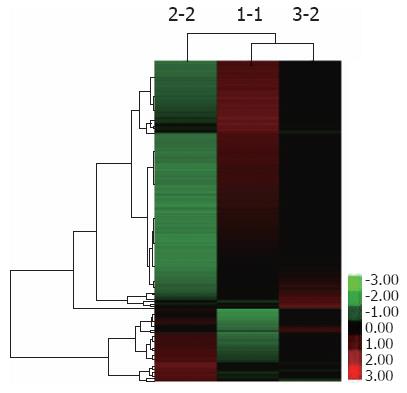
Figure 4 Cluster analysis of gene expression profiles in GES-1 cells in response to the most and least virulent Helicobacter pylori strains.
The red, green, and black colors indicate up-regulated, down-regulated, and equivalent expression. 1-1: Uninfected GES-1 cells (control); 2-2: GES-1 cells co-cultured with the GC-derived strain; 3-2: GES-1 cells co-cultured with the CG-derived strain. GC: Gastric carcinoma; CG: Chronic gastritis.
-
Citation: Wang F, Luo LD, Pan JH, Huang LH, Lv HW, Guo Q, Xu CX, Shen SR. Comparative genomic study of gastric epithelial cells co-cultured with
Helicobacter pylori . World J Gastroenterol 2012; 18(48): 7212-7224 - URL: https://www.wjgnet.com/1007-9327/full/v18/i48/7212.htm
- DOI: https://dx.doi.org/10.3748/wjg.v18.i48.7212


