Copyright
©2012 Baishideng Publishing Group Co.
World J Gastroenterol. Nov 7, 2012; 18(41): 5889-5896
Published online Nov 7, 2012. doi: 10.3748/wjg.v18.i41.5889
Published online Nov 7, 2012. doi: 10.3748/wjg.v18.i41.5889
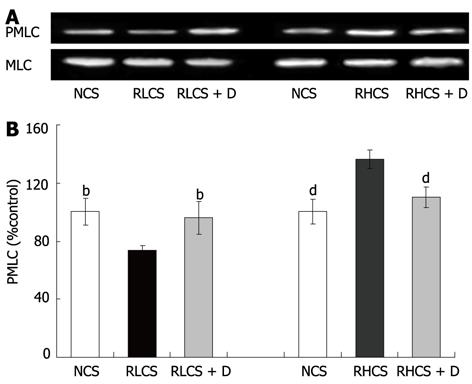
Figure 2 Western blotting analysis of the phosphorylation of myosin light chain.
A: Representative images of Western blotting of the phosphorylation of myosin light chain (PMLC) of jejunum; B: Statistical analysis of band intensities of the PMLC in 4 independent experiments in normal contractile state (NCS, control), representative low contractile state (RLCS), and representative high contractile state (RHCS). To correct for loading variations, the result is expressed as a ratio of phosphor-myosin light chain to myosin light chain and NCS control is defined as 100%. Data represent mean ± SE from 4 independent experiments; bP < 0.01 vs RLCS; dP < 0.01 vs RHCS. D: Deslanoside.
- Citation: Chen DP, Xiong YJ, Tang ZY, Yao QY, Ye DM, Liu SS, Lin Y. Characteristics of deslanoside-induced modulation on jejunal contractility. World J Gastroenterol 2012; 18(41): 5889-5896
- URL: https://www.wjgnet.com/1007-9327/full/v18/i41/5889.htm
- DOI: https://dx.doi.org/10.3748/wjg.v18.i41.5889


