Copyright
©2012 Baishideng Publishing Group Co.
World J Gastroenterol. Nov 7, 2012; 18(41): 5879-5888
Published online Nov 7, 2012. doi: 10.3748/wjg.v18.i41.5879
Published online Nov 7, 2012. doi: 10.3748/wjg.v18.i41.5879
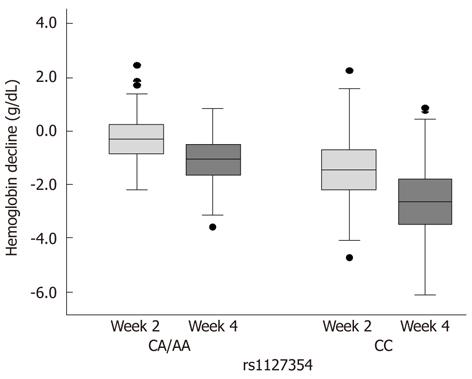
Figure 2 Hemoglobin decline from baseline at week 2 and 4 of treatment according to the inosine triphosphatase single nucleotide polymorphism rs1127354 genotypes.
Bars within boxes denote the median value of hemoglobin (Hb) decline from baseline. The boxes and the lower and upper bars represent the 25th to 75th percentiles, and the 10th and 90th percentiles, respectively. The single nucleotide polymorphism genotype significantly influenced Hb decline at week 2 and 4 (P = 5.437 × 10⁻⁹ in repeated measures analysis of variance).
-
Citation: Tsubota A, Shimada N, Abe H, Yoshizawa K, Agata R, Yumoto Y, Ika M, Namiki Y, Nagatsuma K, Matsudaira H, Fujise K, Tada N, Aizawa Y. Several factors including
ITPA polymorphism influence ribavirin-induced anemia in chronic hepatitis C. World J Gastroenterol 2012; 18(41): 5879-5888 - URL: https://www.wjgnet.com/1007-9327/full/v18/i41/5879.htm
- DOI: https://dx.doi.org/10.3748/wjg.v18.i41.5879


