Copyright
©2012 Baishideng Publishing Group Co.
World J Gastroenterol. Nov 7, 2012; 18(41): 5870-5878
Published online Nov 7, 2012. doi: 10.3748/wjg.v18.i41.5870
Published online Nov 7, 2012. doi: 10.3748/wjg.v18.i41.5870
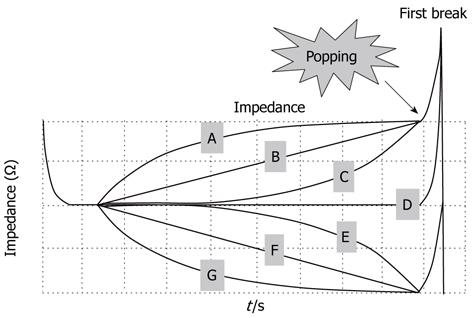
Figure 4 The graph showing the characteristic impedance curve shapes leading to the break point.
The graph showing the seven characteristic impedance curves leading to the break point, which dictated the subgroups into which the previously classified nodules were further sorted. A-C: Increasing type; D: Flat type; E-G: Decreasing type; B, D, F: Three characteristic impedance curve shapes leading to the first break point, into which the 148 nodules were classified: increasing, flat and decreasing.
- Citation: Iida H, Aihara T, Ikuta S, Yamanaka N. Effectiveness of impedance monitoring during radiofrequency ablation for predicting popping. World J Gastroenterol 2012; 18(41): 5870-5878
- URL: https://www.wjgnet.com/1007-9327/full/v18/i41/5870.htm
- DOI: https://dx.doi.org/10.3748/wjg.v18.i41.5870


