Copyright
©2012 Baishideng Publishing Group Co.
World J Gastroenterol. Oct 28, 2012; 18(40): 5793-5798
Published online Oct 28, 2012. doi: 10.3748/wjg.v18.i40.5793
Published online Oct 28, 2012. doi: 10.3748/wjg.v18.i40.5793
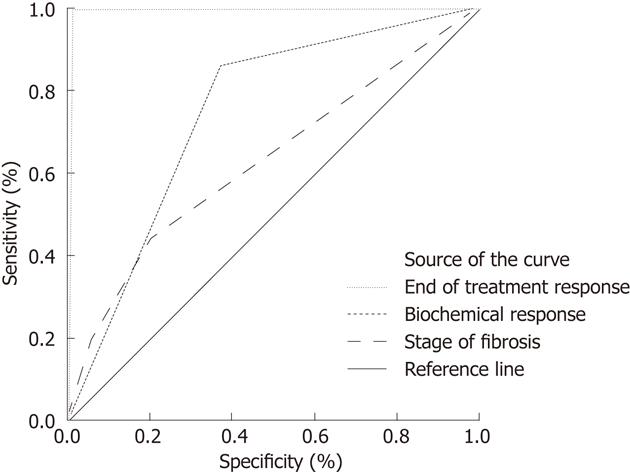
Figure 1 Receiver operating characteristic curve comparing end of treatment response, biochemical response, stage of fibrosis with sustained viral response.
Receiver operating characteristic curve showing comparison between end of treatment response [area under curves (AUC) 0.997, 95% CI: 0.99-1.004], biochemical response (AUC 0.744, 95% CI: 0.67-0.81), stage of fibrosis (AUC 0.625, 95% CI: 0.54-0.70). The best predictor was end of treatment response at 99.7% (P = 0.001), followed by biochemical response 74.4% (P = 0.001) and stage of fibrosis 62.5% (P = 0.002).
- Citation: Samiullah S, Bikharam D, Nasreen. Treatment of chronic hepatitis delta virus with peg-interferon and factors that predict sustained viral response. World J Gastroenterol 2012; 18(40): 5793-5798
- URL: https://www.wjgnet.com/1007-9327/full/v18/i40/5793.htm
- DOI: https://dx.doi.org/10.3748/wjg.v18.i40.5793


