Copyright
©2012 Baishideng Publishing Group Co.
World J Gastroenterol. Jan 28, 2012; 18(4): 323-330
Published online Jan 28, 2012. doi: 10.3748/wjg.v18.i4.323
Published online Jan 28, 2012. doi: 10.3748/wjg.v18.i4.323
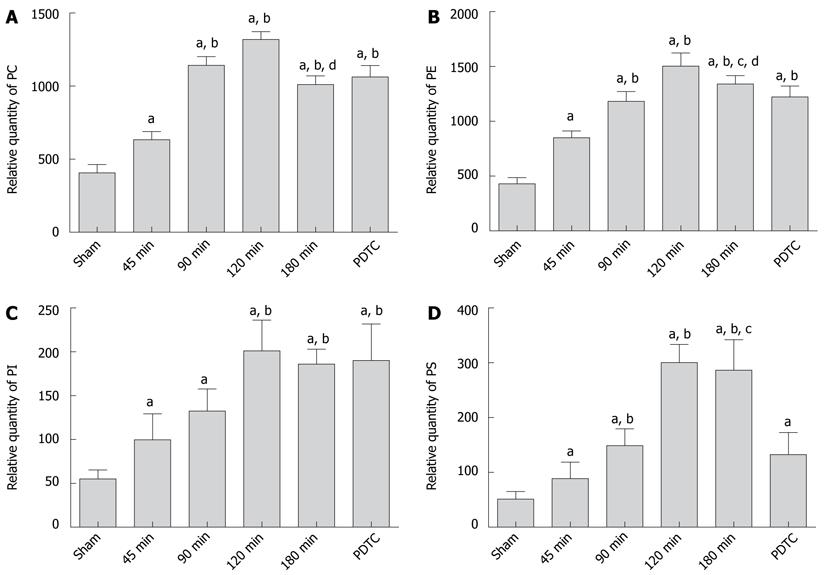
Figure 5 Relative quantities of pulmonary phospholipids.
A: Relative quantity of PC; B: Relative quantity of PE; C: Relative quantity of PI; D: Relative quantity of PS. With CPT prolonged, the levels of pulmonary phospholipids increased significantly, reaching a peak in the 120-min group, and then declined in the 180-min group. The use of PDTC could inhibit the expression of PE and PS, but could not observe significant effect in PC and PI. aP < 0.05 vs sham group; bP < 0.05 vs 45-min group; cP < 0.05 vs PDTC group; dP < 0.05 vs 120-min group. PDTC: Pyrrolidinedithiocarbamate; CPT: Cold preservation time; PC: Phosphatidylcholine; PE: Phosphatidylethanolamine; PI: Phosphatidylinositol; PS: Phosphatidylserine.
- Citation: Jiang A, Liu C, Liu F, Song YL, Li QY, Yu L, Lv Y. Liver cold preservation induce lung surfactant changes and acute lung injury in rat liver transplantation. World J Gastroenterol 2012; 18(4): 323-330
- URL: https://www.wjgnet.com/1007-9327/full/v18/i4/323.htm
- DOI: https://dx.doi.org/10.3748/wjg.v18.i4.323


