Copyright
©2012 Baishideng Publishing Group Co.
World J Gastroenterol. Jan 28, 2012; 18(4): 309-322
Published online Jan 28, 2012. doi: 10.3748/wjg.v18.i4.309
Published online Jan 28, 2012. doi: 10.3748/wjg.v18.i4.309
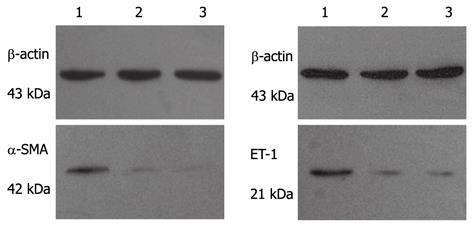
Figure 9 Western blotting analysis of α smooth muscle actin and endothelin-1 expression in liver tissues.
Lane 1: The untreated cirrhotic group; Lane 2: The cell transplantation group; Lane 3: The normal control group. SMA: Smooth muscle actin. ET-1: Endothelin-1.
- Citation: Bin WT, Ma LM, Xu Q, Shi XL. Embryonic hepatocyte transplantation for hepatic cirrhosis: Efficacy and mechanism of action. World J Gastroenterol 2012; 18(4): 309-322
- URL: https://www.wjgnet.com/1007-9327/full/v18/i4/309.htm
- DOI: https://dx.doi.org/10.3748/wjg.v18.i4.309


