Copyright
©2012 Baishideng Publishing Group Co.
World J Gastroenterol. Jan 28, 2012; 18(4): 309-322
Published online Jan 28, 2012. doi: 10.3748/wjg.v18.i4.309
Published online Jan 28, 2012. doi: 10.3748/wjg.v18.i4.309
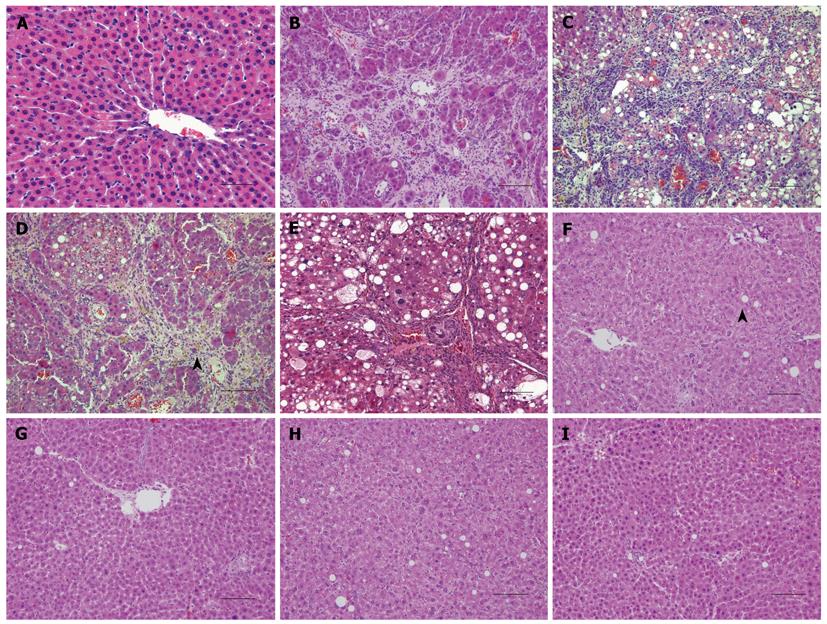
Figure 6 Hematoxylin and eosin staining of tissue slices from rat livers in each group.
A: Normal liver lobules from the normal control group; B-E: Pseudo-lobules, fatty degeneration, necrotic hepatocytes, brown pigmentation (arrow) in livers from the untreated cirrhotic group; F-I: Sections from the cell transplantation group; a few cells have vacuoles (arrow), and liver lobules are present. Scale bars: 20 μm.
- Citation: Bin WT, Ma LM, Xu Q, Shi XL. Embryonic hepatocyte transplantation for hepatic cirrhosis: Efficacy and mechanism of action. World J Gastroenterol 2012; 18(4): 309-322
- URL: https://www.wjgnet.com/1007-9327/full/v18/i4/309.htm
- DOI: https://dx.doi.org/10.3748/wjg.v18.i4.309


