Copyright
©2012 Baishideng Publishing Group Co.
World J Gastroenterol. Sep 28, 2012; 18(36): 5027-5033
Published online Sep 28, 2012. doi: 10.3748/wjg.v18.i36.5027
Published online Sep 28, 2012. doi: 10.3748/wjg.v18.i36.5027
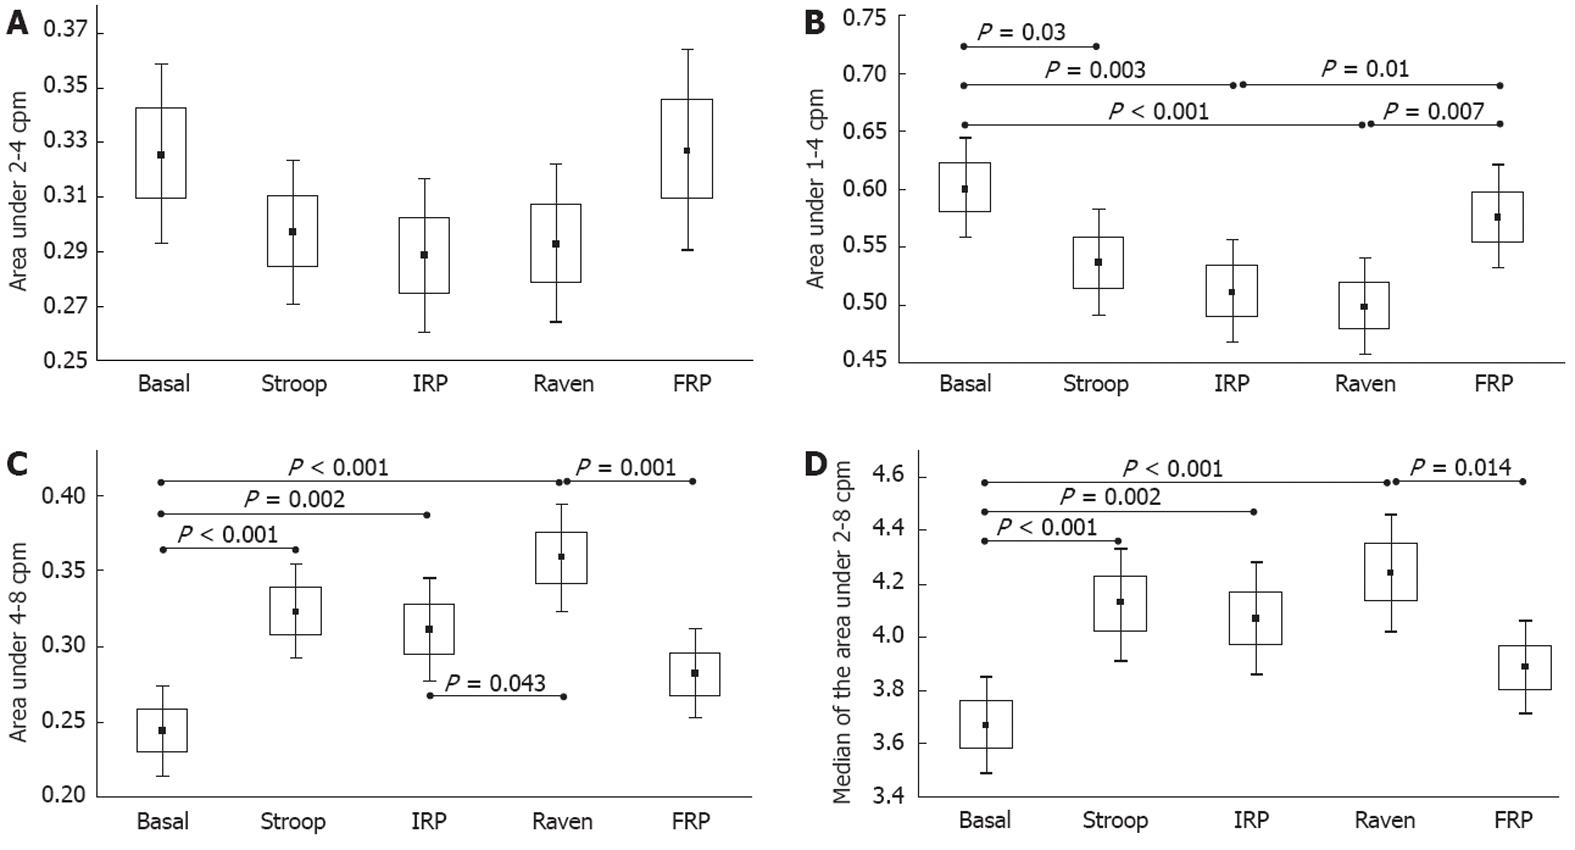
Figure 3 Changes in the relative area under the frequency spectrum of the gastric electrical bio-impedance signal (mean ± SE).
A: From 2 to 4 cpm; B: From 1 to 4 cpm; C: From 4 to 8 cpm; D: Median of the area from 2 to 8 cpm. Basal: Basal gastric motility recording; Stroop: Recording during the Stroop Test; IRP: Intermediate resting period; Raven: Recording during the Raven test; FRP: Final resting period.
- Citation: Huerta-Franco MR, Vargas-Luna M, Montes-Frausto JB, Morales-Mata I, Ramirez-Padilla L. Effect of psychological stress on gastric motility assessed by electrical bio-impedance. World J Gastroenterol 2012; 18(36): 5027-5033
- URL: https://www.wjgnet.com/1007-9327/full/v18/i36/5027.htm
- DOI: https://dx.doi.org/10.3748/wjg.v18.i36.5027


