Copyright
©2012 Baishideng Publishing Group Co.
World J Gastroenterol. Sep 28, 2012; 18(36): 5027-5033
Published online Sep 28, 2012. doi: 10.3748/wjg.v18.i36.5027
Published online Sep 28, 2012. doi: 10.3748/wjg.v18.i36.5027
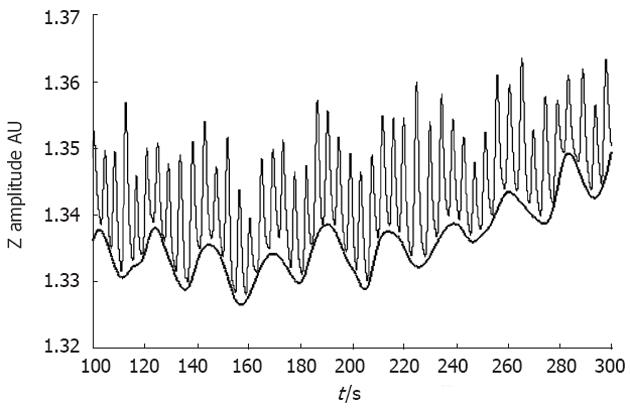
Figure 1 Raw data of the gastric bio-impedance signal showing mainly the breathing oscillations (fast oscillations) and the gastric contribution (2-4/min), which are shown by the dashed curve.
AU: Arbitrary units.
- Citation: Huerta-Franco MR, Vargas-Luna M, Montes-Frausto JB, Morales-Mata I, Ramirez-Padilla L. Effect of psychological stress on gastric motility assessed by electrical bio-impedance. World J Gastroenterol 2012; 18(36): 5027-5033
- URL: https://www.wjgnet.com/1007-9327/full/v18/i36/5027.htm
- DOI: https://dx.doi.org/10.3748/wjg.v18.i36.5027


