Copyright
©2012 Baishideng Publishing Group Co.
World J Gastroenterol. Sep 14, 2012; 18(34): 4781-4786
Published online Sep 14, 2012. doi: 10.3748/wjg.v18.i34.4781
Published online Sep 14, 2012. doi: 10.3748/wjg.v18.i34.4781
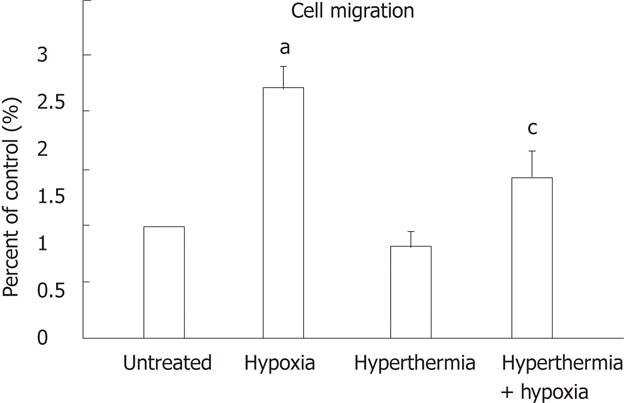
Figure 5 Migration assay of HepG2 cells treated with hyperthermia or hypoxia.
Quantification of the cell migration results from three experiments: each bar (hypoxia-, hyperthermia-, hyperthermia + hypoxia-treated cells) represents the relative levels observed in untreated cells (control). aP < 0.05 vs untreated cells; cP < 0.05 vs hypoxia-treated cells.
- Citation: Yuan GJ, Li QW, Shan SL, Wang WM, Jiang S, Xu XM. Hyperthermia inhibits hypoxia-induced epithelial-mesenchymal transition in HepG2 hepatocellular carcinoma cells. World J Gastroenterol 2012; 18(34): 4781-4786
- URL: https://www.wjgnet.com/1007-9327/full/v18/i34/4781.htm
- DOI: https://dx.doi.org/10.3748/wjg.v18.i34.4781


