Copyright
©2012 Baishideng Publishing Group Co.
World J Gastroenterol. Aug 28, 2012; 18(32): 4278-4287
Published online Aug 28, 2012. doi: 10.3748/wjg.v18.i32.4278
Published online Aug 28, 2012. doi: 10.3748/wjg.v18.i32.4278
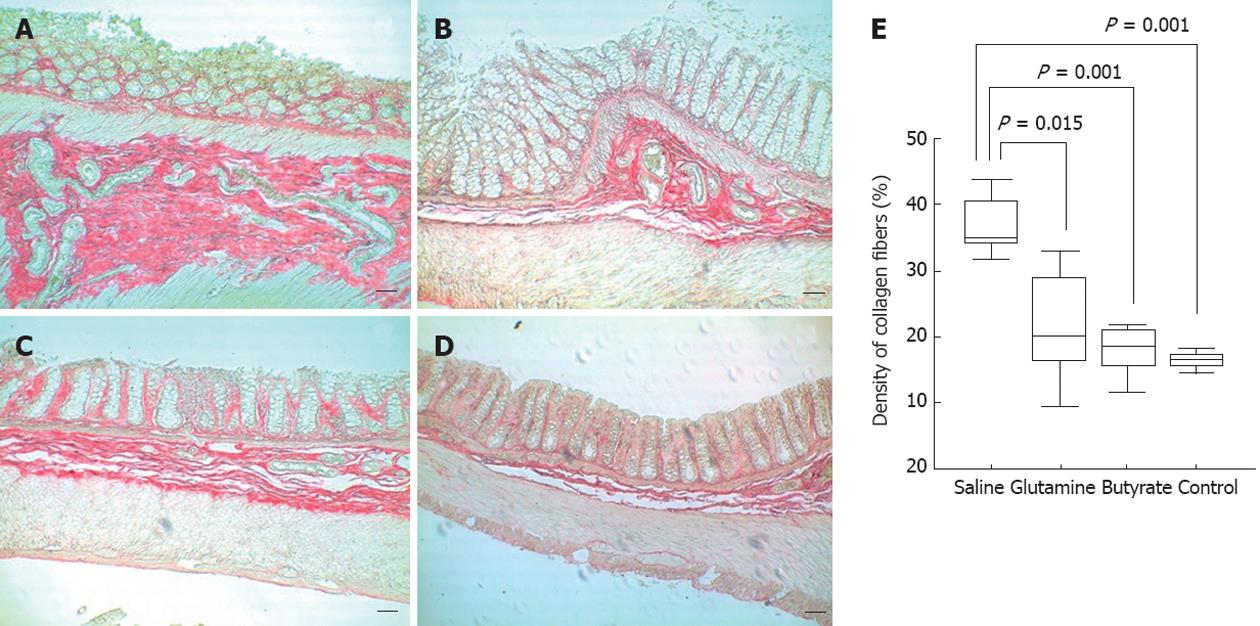
Figure 5 Quantitative analysis of collagen fiber deposition in picric acid-stained slidesand apoptotic terminal deoxynucleotidyl transferase dUTP nick end labeling-positive cells of diverted colon samples obtained at 8 wk.
Images show a significant increase of collagen density in slides from animals with placebo-treated (A) colitis compared to (B) glutamine-treated, butyrate-treated (C) and control animals (D). Images were captured at ×100 magnification. In the slides, bars represent 50 μm. In the graph (E), horizontal bars represent medians, boxes represent the 25th and 75th percentiles, and vertical bars represent ranges. Significant differences are noted (n = 6 in each group).
- Citation: Pacheco RG, Esposito CC, Müller LC, Castelo-Branco MT, Quintella LP, Chagas VLA, de Souza HSP, Schanaider A. Use of butyrate or glutamine in enema solution reduces inflammation and fibrosis in experimental diversion colitis. World J Gastroenterol 2012; 18(32): 4278-4287
- URL: https://www.wjgnet.com/1007-9327/full/v18/i32/4278.htm
- DOI: https://dx.doi.org/10.3748/wjg.v18.i32.4278


