Copyright
©2012 Baishideng Publishing Group Co.
World J Gastroenterol. Aug 21, 2012; 18(31): 4156-4161
Published online Aug 21, 2012. doi: 10.3748/wjg.v18.i31.4156
Published online Aug 21, 2012. doi: 10.3748/wjg.v18.i31.4156
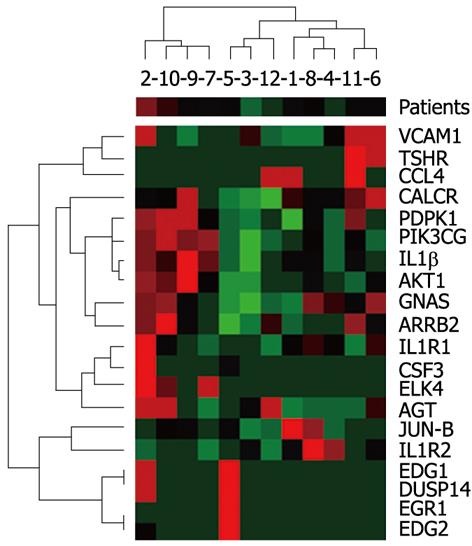
Figure 1 Agglomerative hierarchical clustering methods of genes expression.
The dendrogram assigned to the numerical value on the horizontal axis describes the patients’ correlation; the dendrogram assigned to individual genes on the vertical axis describes the genes’ correlation. Figures on the x-axis denote patient order. VCAM1: Vascular cell adhesion molecule 1; TSHR: Thyroid stimulating hormone receptor; CCL4: Chemokine (C-C motif) ligand 4; CALCR: Calcitonin receptor; PDPK1: 3-phosphoinositide-dependent protein kinase-1; PIK3CG: Phosphoinositide 3-kinase; IL1β: Interleukin 1β; AKT1: Protein kinase A; GNAS: α subunit of G-coupled protein; ARRB2: Arrestin β; IL1R1: Interleukin 1 receptor, type I; CSF3: Colony stimulating factor-3; ELK4: ETS-domain protein; AGT: Angiotensinogen; JUN-B: Transcription factor jun-B; IL1R2: Interleukin 1 receptor, type II; EDG1: Sphingosine-1-phosphate receptor 1; DUSP14: Dual-specificity protein phosphatases 14; EGR1: Early growth response protein 1; EDG2: Lysophosphatidic acid receptor.
- Citation: Cieśla A, Kuśmider M, Faron-Górecka A, Dziedzicka-Wasylewska M, Bociąga-Jasik M, Owczarek D, Ciećko-Michalska I, Cibor D, Mach T. Intrahepatic expression of genes related to metabotropic receptors in chronic hepatitis. World J Gastroenterol 2012; 18(31): 4156-4161
- URL: https://www.wjgnet.com/1007-9327/full/v18/i31/4156.htm
- DOI: https://dx.doi.org/10.3748/wjg.v18.i31.4156


