Copyright
©2012 Baishideng Publishing Group Co.
World J Gastroenterol. Aug 21, 2012; 18(31): 4127-4135
Published online Aug 21, 2012. doi: 10.3748/wjg.v18.i31.4127
Published online Aug 21, 2012. doi: 10.3748/wjg.v18.i31.4127
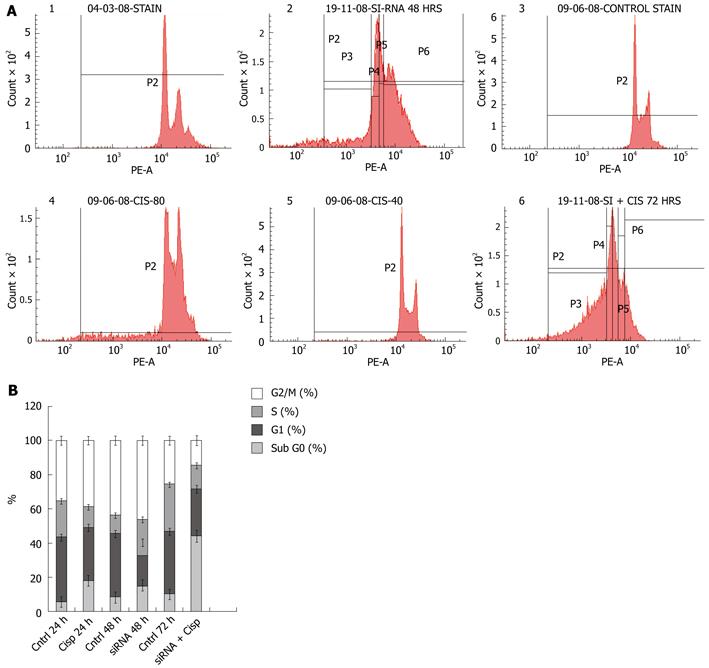
Figure 5 Cell cycle analyses.
A: TC21-knockdown cells (20 nmol siRNA for 48 h) were treated with cisplatin (8 μg/mL) for 24 h and cell cycle analysis was performed by labeling cells with DNA binding dye propidium iodide. The panel shows 1: DNA histograms of mock-transfected TE13 cells for 48 h; 2: TE13 cells transfected with TC21 siRNA for 48 h showing increased cell death; 3: TE13 cells without transfection for 24 h; 4: TE13 cells were treated with cisplatin alone for 24 h; 5: TE13 cells without transfection for 72 h; 6: TE13 cells were transfected with TC21siRNA for 48 h for optimal knockdown followed by cisplatin at 8 μg/mL for 24 h; B: Stacked bar graph depicts the cell cycle distribution. Data presented here as mean of percentage events from 3 independent experiments.
- Citation: Hasan MR, Chauhan SS, Sharma R, Ralhan R. siRNA-mediated downregulation of TC21 sensitizes esophageal cancer cells to cisplatin. World J Gastroenterol 2012; 18(31): 4127-4135
- URL: https://www.wjgnet.com/1007-9327/full/v18/i31/4127.htm
- DOI: https://dx.doi.org/10.3748/wjg.v18.i31.4127


