Copyright
©2012 Baishideng Publishing Group Co.
World J Gastroenterol. Jan 21, 2012; 18(3): 285-290
Published online Jan 21, 2012. doi: 10.3748/wjg.v18.i3.285
Published online Jan 21, 2012. doi: 10.3748/wjg.v18.i3.285
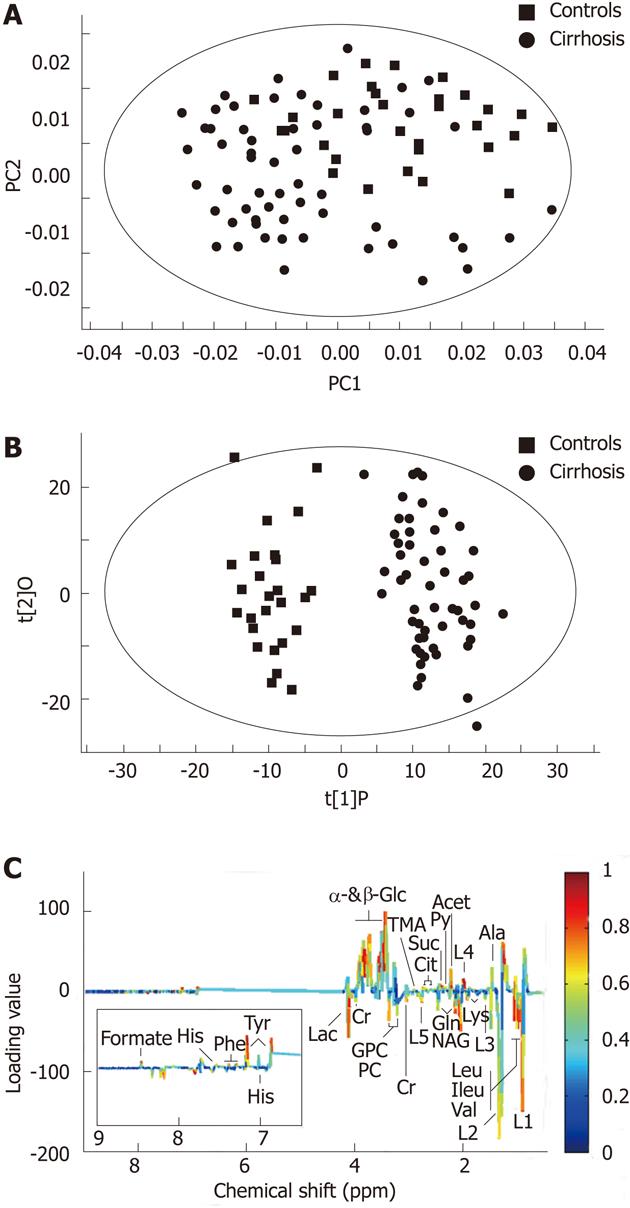
Figure 2 Multivariate modeling of control and cirrhotic subjects.
A: Principal component analysis score plot of the serum 1H nuclear magnetic resonance spectra from controls (squares) and cirrhotic patients (dots); B: Orthogonal partial least-squares discriminant analysis (OPLS-DA) score plot of controls (squares) and cirrhotic patients (dots); C: Corresponding coefficient loading plots for the discrimination of the OPLS-DA model.
- Citation: Qi SW, Tu ZG, Peng WJ, Wang LX, Ou-Yang X, Cai AJ, Dai Y. 1H NMR-based serum metabolic profiling in compensated and decompensated cirrhosis. World J Gastroenterol 2012; 18(3): 285-290
- URL: https://www.wjgnet.com/1007-9327/full/v18/i3/285.htm
- DOI: https://dx.doi.org/10.3748/wjg.v18.i3.285


