Copyright
©2012 Baishideng Publishing Group Co.
World J Gastroenterol. Jul 7, 2012; 18(25): 3288-3295
Published online Jul 7, 2012. doi: 10.3748/wjg.v18.i25.3288
Published online Jul 7, 2012. doi: 10.3748/wjg.v18.i25.3288
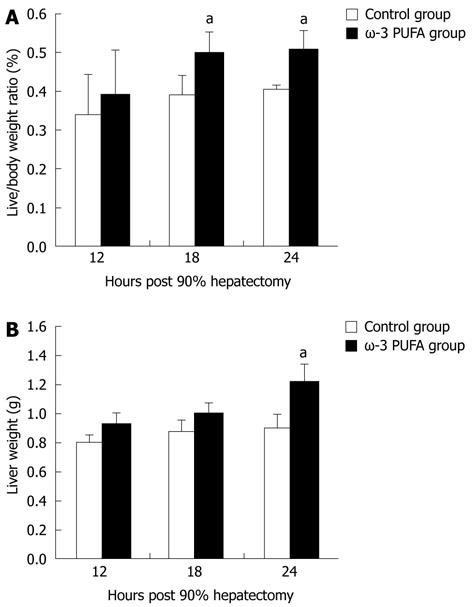
Figure 2 Change in liver weight/body weight ratios and liver weights after partial hepatectomy.
Liver weight/body weight ratios (A) and liver weights (B) in the control and the omega-3 polyunsaturated fatty acid (ω-3 PUFA) group at 12 h, 18 h and 24 h post-hepatectomy. Data are expressed as mean ± SD. n = 6 in each group. aP < 0.05 vs normal group.
- Citation: Qiu YD, Wang S, Yang Y, Yan XP. Omega-3 polyunsaturated fatty acids promote liver regeneration after 90% hepatectomy in rats. World J Gastroenterol 2012; 18(25): 3288-3295
- URL: https://www.wjgnet.com/1007-9327/full/v18/i25/3288.htm
- DOI: https://dx.doi.org/10.3748/wjg.v18.i25.3288


