Copyright
©2012 Baishideng Publishing Group Co.
World J Gastroenterol. Jun 28, 2012; 18(24): 3138-3144
Published online Jun 28, 2012. doi: 10.3748/wjg.v18.i24.3138
Published online Jun 28, 2012. doi: 10.3748/wjg.v18.i24.3138
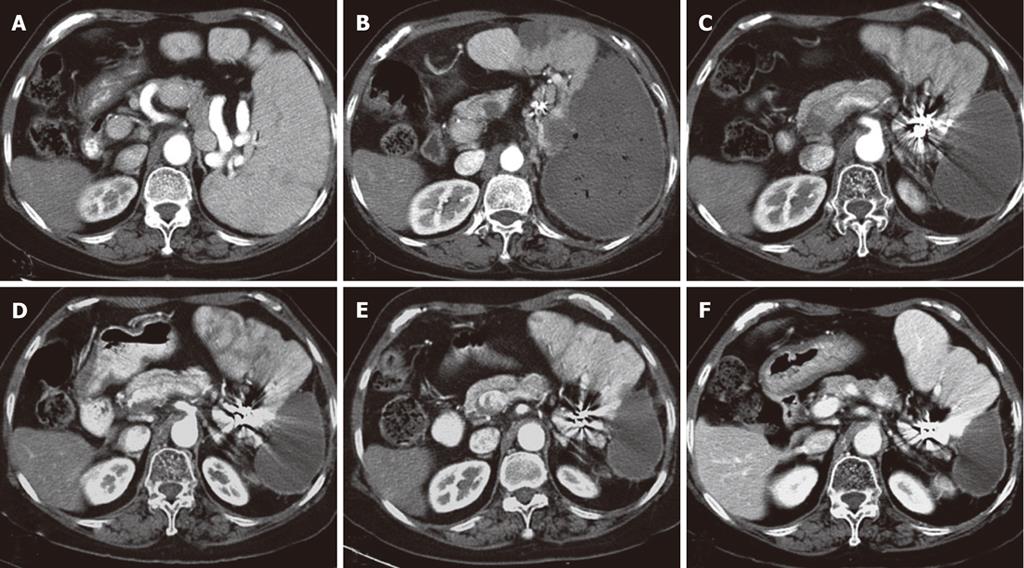
Figure 2 Computed tomographic angiography, arterial phases, before and after splenic artery embolization in the same patient as Figure 1.
A: Before embolization the spleen is enlarged; B: One month after embolization the major portion of the spleen is avascular with minute areas of low attenuation representing residual gas collection. A small part of the spleen was perfused with contrast medium; C: Six months after embolization the low attenuation area has decreased in size; D: One year later the low attenuation area has further decreased in size; E: Two years later the necrotic area has further decreased in size; F: Four years later no significant change is seen.
- Citation: He XH, Gu JJ, Li WT, Peng WJ, Li GD, Wang SP, Xu LC, Ji J. Comparison of total splenic artery embolization and partial splenic embolization for hypersplenism. World J Gastroenterol 2012; 18(24): 3138-3144
- URL: https://www.wjgnet.com/1007-9327/full/v18/i24/3138.htm
- DOI: https://dx.doi.org/10.3748/wjg.v18.i24.3138


