Copyright
©2012 Baishideng Publishing Group Co.
World J Gastroenterol. Jun 28, 2012; 18(24): 3129-3137
Published online Jun 28, 2012. doi: 10.3748/wjg.v18.i24.3129
Published online Jun 28, 2012. doi: 10.3748/wjg.v18.i24.3129
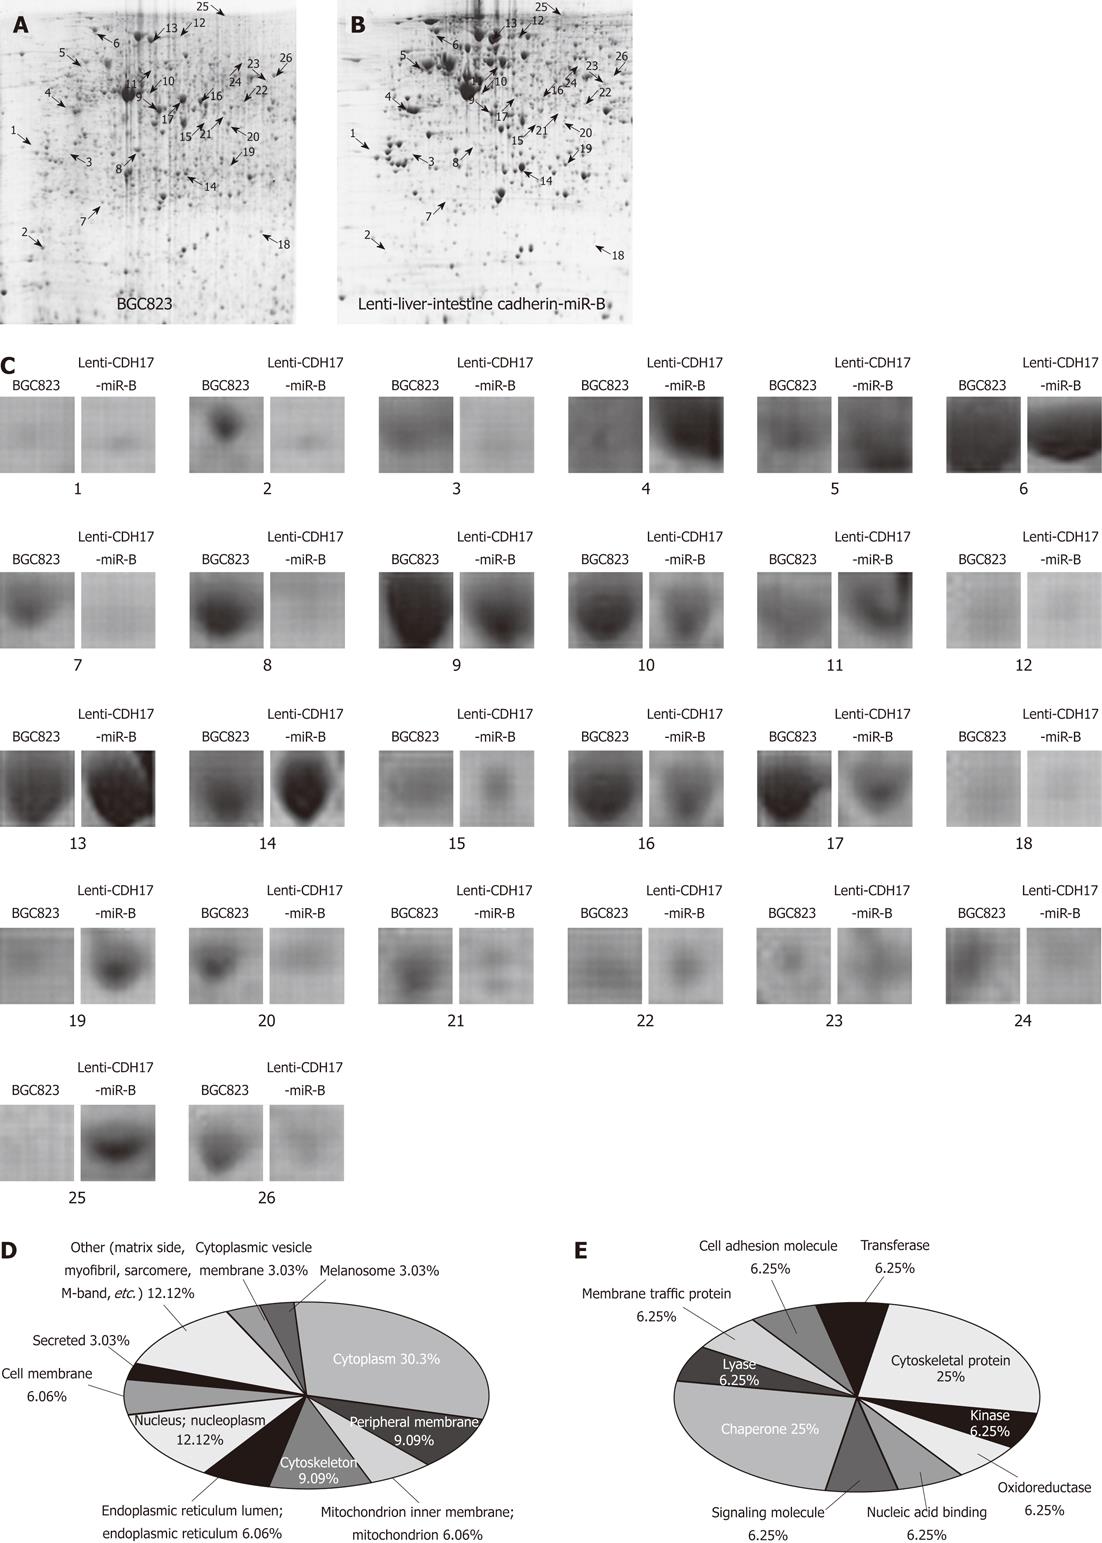
Figure 4 Protein profile differences between lenti-liver-intestine cadherin-miR-B and BGC823 cells.
A, B: Comparison of protein profiles by 2-dimensional gel electrophoresis between BGC823 and lenti-liver-intestine cadherin (CDH17)-miR-B cells; C: Close-up image of differential expression of protein spots with intensity alterations > 3-fold and recurrence four or more times in independent experiments. The average intensity of each spot was determined using PDQuest 2-DE software; D: Cellular location of the 15 altered proteins identified by mass spectrometry; E: Molecular functions of the 15 altered proteins identified by mass spectrometry.
-
Citation: Xu Y, Zhang J, Liu QS, Dong WG. Knockdown of liver-intestine cadherin decreases BGC823 cell invasiveness and metastasis
in vivo . World J Gastroenterol 2012; 18(24): 3129-3137 - URL: https://www.wjgnet.com/1007-9327/full/v18/i24/3129.htm
- DOI: https://dx.doi.org/10.3748/wjg.v18.i24.3129


