Copyright
©2012 Baishideng Publishing Group Co.
World J Gastroenterol. Apr 28, 2012; 18(16): 1903-1914
Published online Apr 28, 2012. doi: 10.3748/wjg.v18.i16.1903
Published online Apr 28, 2012. doi: 10.3748/wjg.v18.i16.1903
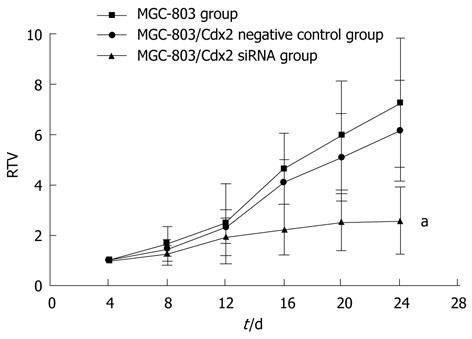
Figure 10 Tumor growth curve showed a significant growth tendency in MGC-803 cells and in MGC-803/Cdx2 negative control cells, while the tumor growth in MGC-803/Cdx2 small interference RNA cells was obviously inhibited.
MGC-803 cells, MGC-803/Cdx2 negative control cells and MGC-803/Cdx2 small interference RNA (siRNA) cells were implanted subcutaneously into the flanks of the nude mice. The relative tumor volume (RTV) of nude mice in each group were presented. Each time point represented the mean of RTV for each group; aP < 0.05 for MGC-803/Cdx2 siRNA group vs MGC-803 and MGC-803/Cdx2 negative control group.
- Citation: Wang XT, Xie YB, Xiao Q. siRNA targeting of Cdx2 inhibits growth of human gastric cancer MGC-803 cells. World J Gastroenterol 2012; 18(16): 1903-1914
- URL: https://www.wjgnet.com/1007-9327/full/v18/i16/1903.htm
- DOI: https://dx.doi.org/10.3748/wjg.v18.i16.1903


