Copyright
©2012 Baishideng Publishing Group Co.
World J Gastroenterol. Apr 28, 2012; 18(16): 1903-1914
Published online Apr 28, 2012. doi: 10.3748/wjg.v18.i16.1903
Published online Apr 28, 2012. doi: 10.3748/wjg.v18.i16.1903
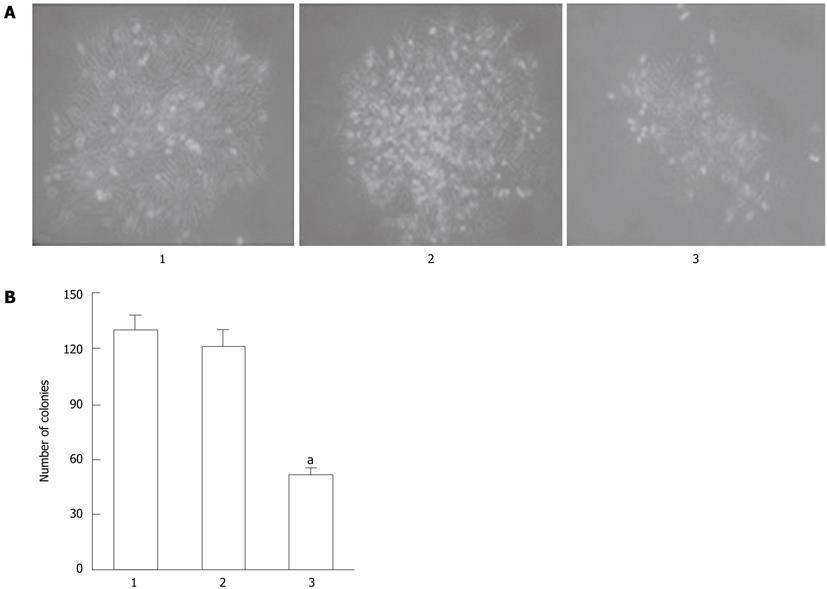
Figure 3 MGC-803/Cdx2 small interference RNA cells exhibited fewer colonies than MGC-803/Cdx2 negative control cells or MGC-803 cells.
A: MGC-803 cells, MGC-803/Cdx2 negative control cells and MGC-803/Cdx2 small interference RNA (siRNA) cells were plated in 6-well plates at a density of 20 cells/cm2, and the colonies were observed under optical microscope at 13 d (×100); B: The surviving fraction of cells (visible colonies) was stained with gentian violet, and counted manually. MGC-803/Cdx2 siRNA cells exhibited fewer colonies than MGC-803/Cdx2 negative control cells or MGC-803 cells. Each column presents as mean ± SE from 3 independent experiments. aP < 0.05 for MGC-803/Cdx2 siRNA group vs MGC-803 and MGC-803/Cdx2 negative control group. Lane 1: MGC-803 group; Lane 2: MGC-803/Cdx2 negative control group; Lane 3: MGC-803/Cdx2 siRNA group.
- Citation: Wang XT, Xie YB, Xiao Q. siRNA targeting of Cdx2 inhibits growth of human gastric cancer MGC-803 cells. World J Gastroenterol 2012; 18(16): 1903-1914
- URL: https://www.wjgnet.com/1007-9327/full/v18/i16/1903.htm
- DOI: https://dx.doi.org/10.3748/wjg.v18.i16.1903


