Copyright
©2012 Baishideng Publishing Group Co.
World J Gastroenterol. Apr 14, 2012; 18(14): 1602-1609
Published online Apr 14, 2012. doi: 10.3748/wjg.v18.i14.1602
Published online Apr 14, 2012. doi: 10.3748/wjg.v18.i14.1602
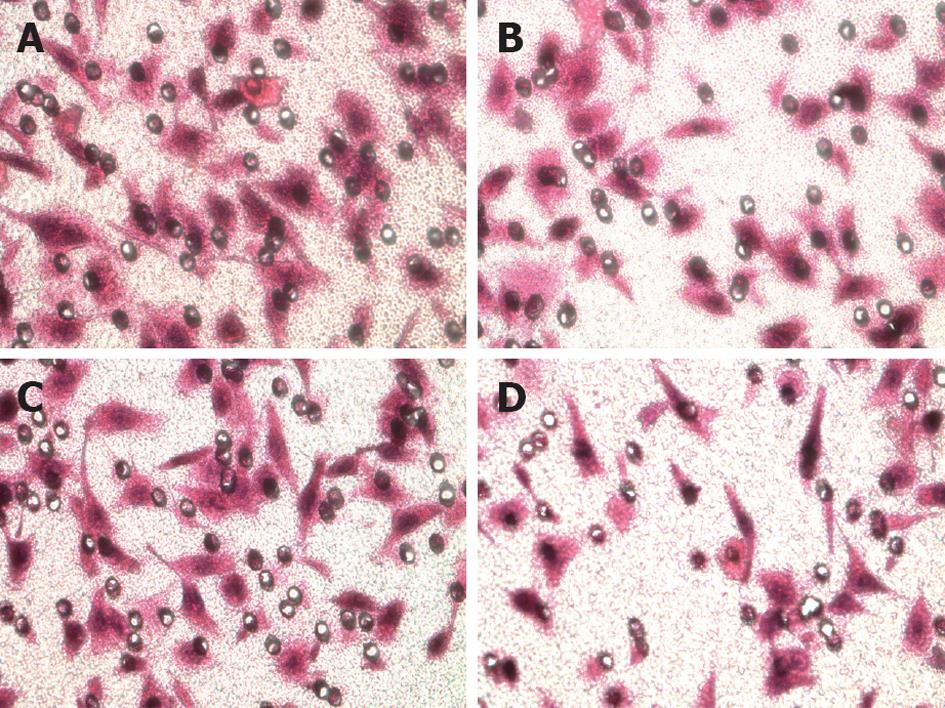
Figure 3 Representative figures of cell migration and invasion in non-treated and toxicarioside A-treated human gastric cancer cell line cells.
A: Migration in the control group; B: Migration in the thetoxicarioside A-treated (4.5 μg/mL) group; C: Invasion in the control group; D: Invasion in the toxicarioside A-treated group.
-
Citation: Guo JL, Zheng SJ, Li YN, Jie W, Hao XB, Li TF, Xia LP, Mei WL, Huang FY, Kong YQ, He QY, Yang K, Tan GH, Dai HF. Toxicarioside A inhibits SGC-7901 proliferation, migration and invasion
via NF-κB/bFGF signaling. World J Gastroenterol 2012; 18(14): 1602-1609 - URL: https://www.wjgnet.com/1007-9327/full/v18/i14/1602.htm
- DOI: https://dx.doi.org/10.3748/wjg.v18.i14.1602


