Copyright
©2012 Baishideng Publishing Group Co.
World J Gastroenterol. Mar 21, 2012; 18(11): 1216-1228
Published online Mar 21, 2012. doi: 10.3748/wjg.v18.i11.1216
Published online Mar 21, 2012. doi: 10.3748/wjg.v18.i11.1216
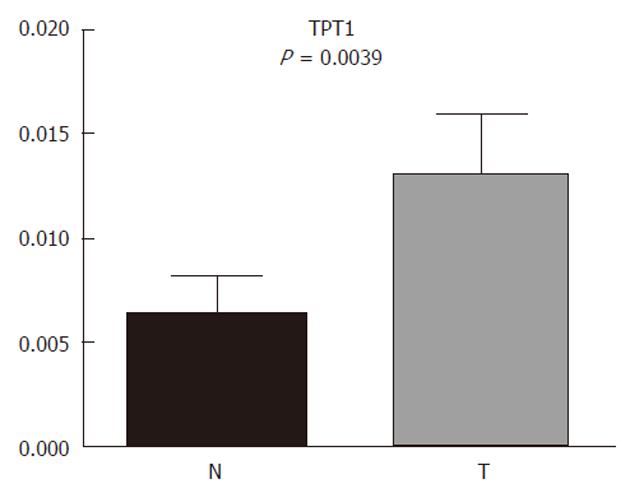
Figure 6 Densitometric results from immunoblotting of 10 pairs of non-tumor and tumor tissue from cardia/gastroesophageal border adenocarcinoma patients.
The x-axis represents non-tumor (N) and tumor (T) tissues and the y-axis represents relative band density. The P value is from the Wilcoxon signed-rank test. TPT1: Translationally controlled tumor protein.
- Citation: Kočevar N, Odreman F, Vindigni A, Grazio SF, Komel R. Proteomic analysis of gastric cancer and immunoblot validation of potential biomarkers. World J Gastroenterol 2012; 18(11): 1216-1228
- URL: https://www.wjgnet.com/1007-9327/full/v18/i11/1216.htm
- DOI: https://dx.doi.org/10.3748/wjg.v18.i11.1216


