Copyright
©2012 Baishideng Publishing Group Co.
World J Gastroenterol. Mar 14, 2012; 18(10): 1077-1084
Published online Mar 14, 2012. doi: 10.3748/wjg.v18.i10.1077
Published online Mar 14, 2012. doi: 10.3748/wjg.v18.i10.1077
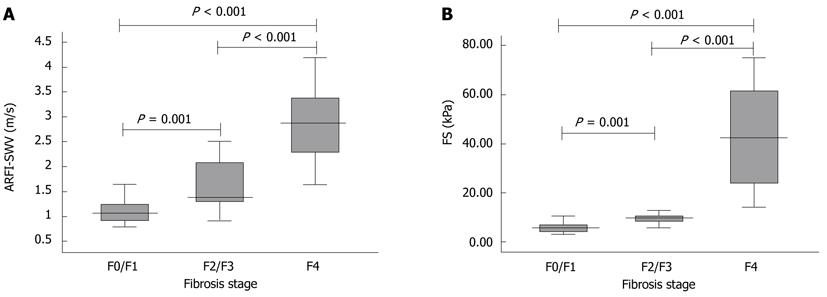
Figure 4 Acoustic radiation force impulse imaging shear wave velocity and liver stiffness measured by transient elastography for the different fibrosis stages in patients who underwent liver biopsy (F0/F1, F2/F3, and F4).
A: ARFI-SWV for the different fibrosis stages in patients who underwent liver biopsy. Box plots show median values with 25th and 75th percentiles of shear wave velocity determined by ARFI (n = 68); B: FS-LS for the different fibrosis stages in patients who underwent liver biopsy (F0/F1, F2/F3, and F4). Box plots show median values with 25th and 75th percentiles of FS-LS (n = 59). ARFI-SWV: Acoustic radiation force impulse imaging shear wave velocity; FS-LS: Liver stiffness measured by transient elastography.
- Citation: Kircheis G, Sagir A, Vogt C, vom Dahl S, Kubitz R, Häussinger D. Evaluation of acoustic radiation force impulse imaging for determination of liver stiffness using transient elastography as a reference. World J Gastroenterol 2012; 18(10): 1077-1084
- URL: https://www.wjgnet.com/1007-9327/full/v18/i10/1077.htm
- DOI: https://dx.doi.org/10.3748/wjg.v18.i10.1077


