Copyright
©2012 Baishideng Publishing Group Co.
World J Gastroenterol. Mar 14, 2012; 18(10): 1048-1058
Published online Mar 14, 2012. doi: 10.3748/wjg.v18.i10.1048
Published online Mar 14, 2012. doi: 10.3748/wjg.v18.i10.1048
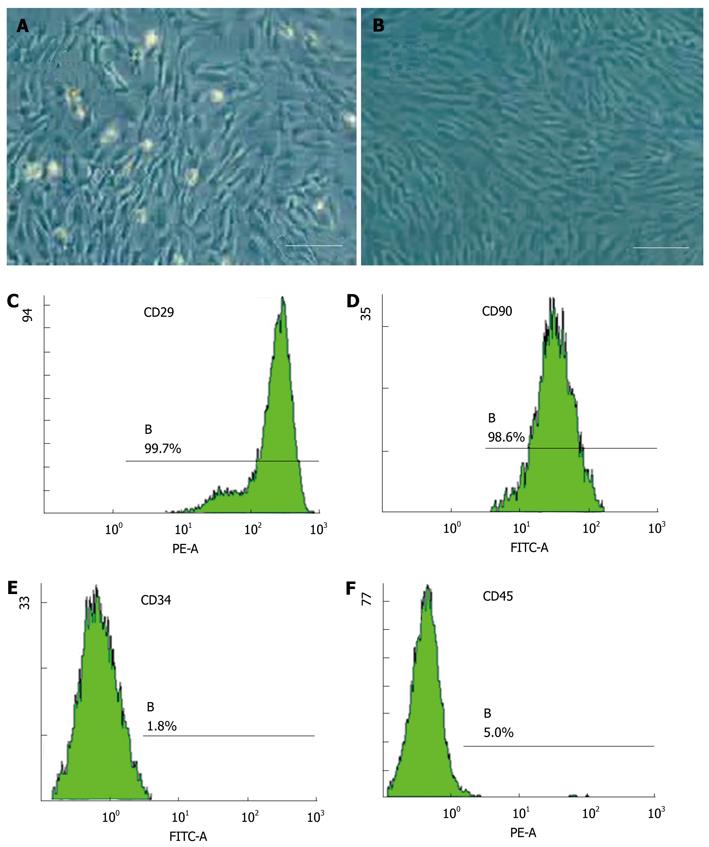
Figure 1 Mesenchymal stem cell culture and identification.
A: The morphology of mesenchymal stem cell (MSC) culture at 3 d (10 × 10 magnification); B: The morphology of MSCs approached 80% confluence (10 × 10 magnification); C: Fluorescence-activated cell sorting (FACS) analysis for MSC positive cell marker CD29; D: FACS analysis for MSC positive cell marker CD90; E: FACS analysis for MSC negative cell marker CD34; F: FACS analysis for MSC negative cell marker CD 45. Scale bars represent 100 mm. FITC: Fluorescein isothiocyanate; PE: Phycoerythrin.
- Citation: Zhao W, Li JJ, Cao DY, Li X, Zhang LY, He Y, Yue SQ, Wang DS, Dou KF. Intravenous injection of mesenchymal stem cells is effective in treating liver fibrosis. World J Gastroenterol 2012; 18(10): 1048-1058
- URL: https://www.wjgnet.com/1007-9327/full/v18/i10/1048.htm
- DOI: https://dx.doi.org/10.3748/wjg.v18.i10.1048


