Copyright
©2012 Baishideng Publishing Group Co.
World J Gastroenterol. Jan 7, 2012; 18(1): 70-78
Published online Jan 7, 2012. doi: 10.3748/wjg.v18.i1.70
Published online Jan 7, 2012. doi: 10.3748/wjg.v18.i1.70
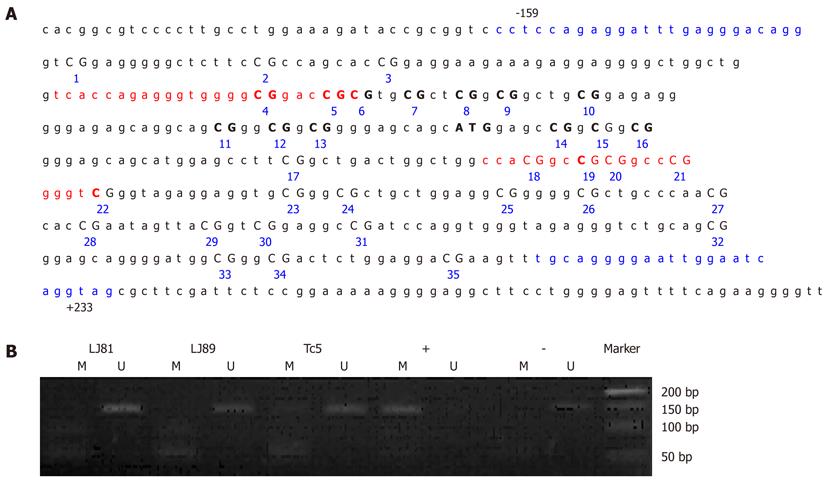
Figure 6 Analysis of the methylation pattern of the P16 gene in blood cells from gastric cancer patients.
A: Map of the P16 promoter region and positions of the primers used in the analysis. The sequence is numbered relative to the translation start site for human P16. Characters in red indicate the primer binding sites for MSP and those in blue for bisulfite sequencing. Individual CpG sites are numbered consecutively; B: MSP of the P16 promoter in peripheral blood from patients with gastric cancer. Marker, DL500 DNA Marker (TaKaRa); +, fully methylated DNA control; -, fully unmethylated DNA control; M, methylated band; U, unmethylated band. As a control, the fragments corresponding to the P16 promoter of fully methylated DNA showed a clear band when amplified with methylated-specific primers and did not display a band when treated with unmethylated primers. The fully unmethylated DNA control showed the reverse pattern.
- Citation: Wu PY, Zhang Z, Wang JM, Guo WW, Xiao N, He Q, Wang YP, Fan YM. Germline promoter hypermethylation of tumor suppressor genes in gastric cancer. World J Gastroenterol 2012; 18(1): 70-78
- URL: https://www.wjgnet.com/1007-9327/full/v18/i1/70.htm
- DOI: https://dx.doi.org/10.3748/wjg.v18.i1.70


