Copyright
©2011 Baishideng Publishing Group Co.
World J Gastroenterol. Mar 7, 2011; 17(9): 1192-1198
Published online Mar 7, 2011. doi: 10.3748/wjg.v17.i9.1192
Published online Mar 7, 2011. doi: 10.3748/wjg.v17.i9.1192
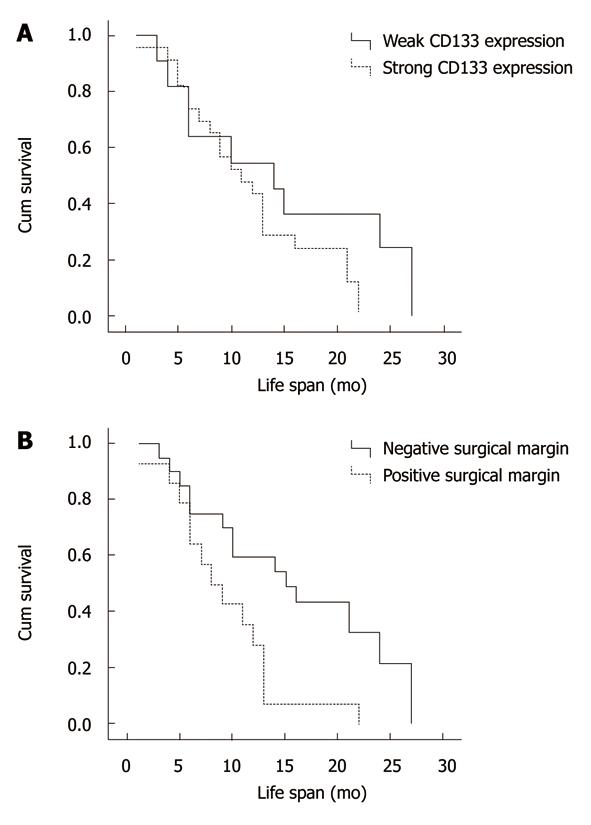
Figure 2 Kaplan-Meier cumulative overall survival curves.
A: Survival curves of patients with strong and weak CD133 expression (P = 0.23); B: Survival curves of patients with positive and negative surgical margin status (P = 0.009).
- Citation: Leelawat K, Thongtawee T, Narong S, Subwongcharoen S, Treepongkaruna SA. Strong expression of CD133 is associated with increased cholangiocarcinoma progression. World J Gastroenterol 2011; 17(9): 1192-1198
- URL: https://www.wjgnet.com/1007-9327/full/v17/i9/1192.htm
- DOI: https://dx.doi.org/10.3748/wjg.v17.i9.1192


