Copyright
©2011 Baishideng Publishing Group Co.
World J Gastroenterol. Feb 28, 2011; 17(8): 996-1003
Published online Feb 28, 2011. doi: 10.3748/wjg.v17.i8.996
Published online Feb 28, 2011. doi: 10.3748/wjg.v17.i8.996
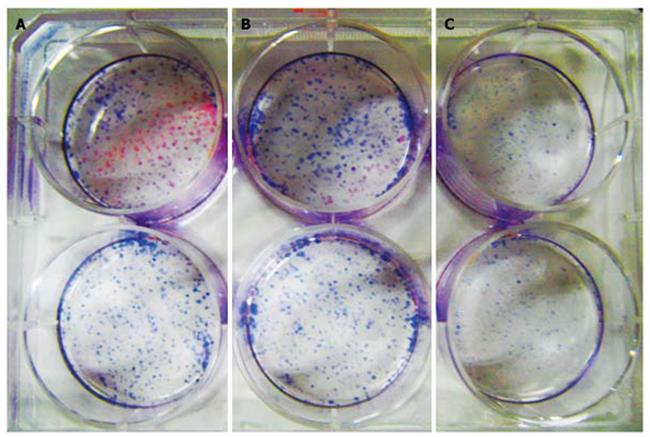
Figure 7 Cell cloning test.
A: More colonies are formed in the control group; B: The colony formed in the 1 mg/L cytosine phosphate-guanosine oligodeoxynucleotides (CPG ODN) treated group is the same as in the control group (P > 0.05); C: There are fewer colonies formed in the 10 mg/L CPG ODN treated group (A vs B, P < 0.01).
- Citation: Wu HQ, Wang B, Zhu SK, Tian Y, Zhang JH, Wu HS. Effects of CPG ODN on biological behavior of PANC-1 and expression of TLR9 in pancreatic cancer. World J Gastroenterol 2011; 17(8): 996-1003
- URL: https://www.wjgnet.com/1007-9327/full/v17/i8/996.htm
- DOI: https://dx.doi.org/10.3748/wjg.v17.i8.996


