Copyright
©2011 Baishideng Publishing Group Co.
World J Gastroenterol. Feb 14, 2011; 17(6): 796-803
Published online Feb 14, 2011. doi: 10.3748/wjg.v17.i6.796
Published online Feb 14, 2011. doi: 10.3748/wjg.v17.i6.796
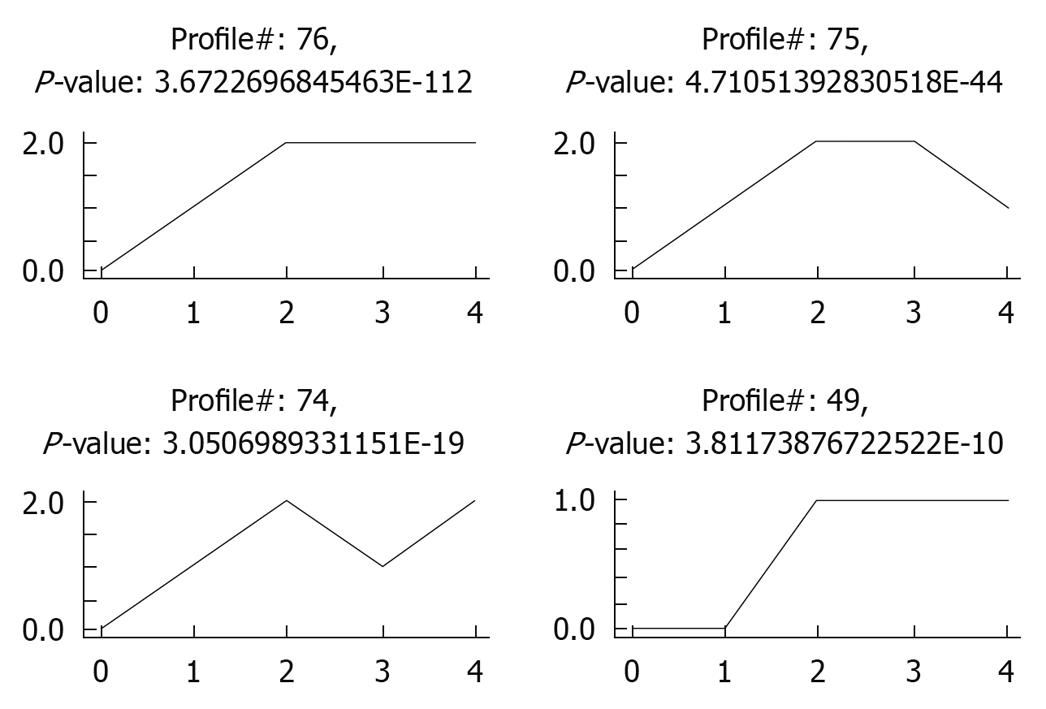
Figure 1 Four most significant expression profiles in liver samples from biliary atresia patients.
0: Normal control group; 1: Neonatal cholestasis group; 2: Group of biliary atresia (BA) patients > 90 d; 3: Group of BA patients at the age of 60-90 d; 4: Group of BA patients < 60 d. Y axis represents the expression change expressed as log2 [v(i)/v(0)].
- Citation: Zhao R, Li H, Shen C, Zheng S. RRAS: A key regulator and an important prognostic biomarker in biliary atresia. World J Gastroenterol 2011; 17(6): 796-803
- URL: https://www.wjgnet.com/1007-9327/full/v17/i6/796.htm
- DOI: https://dx.doi.org/10.3748/wjg.v17.i6.796


