Copyright
©2011 Baishideng Publishing Group Co.
World J Gastroenterol. Feb 14, 2011; 17(6): 750-759
Published online Feb 14, 2011. doi: 10.3748/wjg.v17.i6.750
Published online Feb 14, 2011. doi: 10.3748/wjg.v17.i6.750
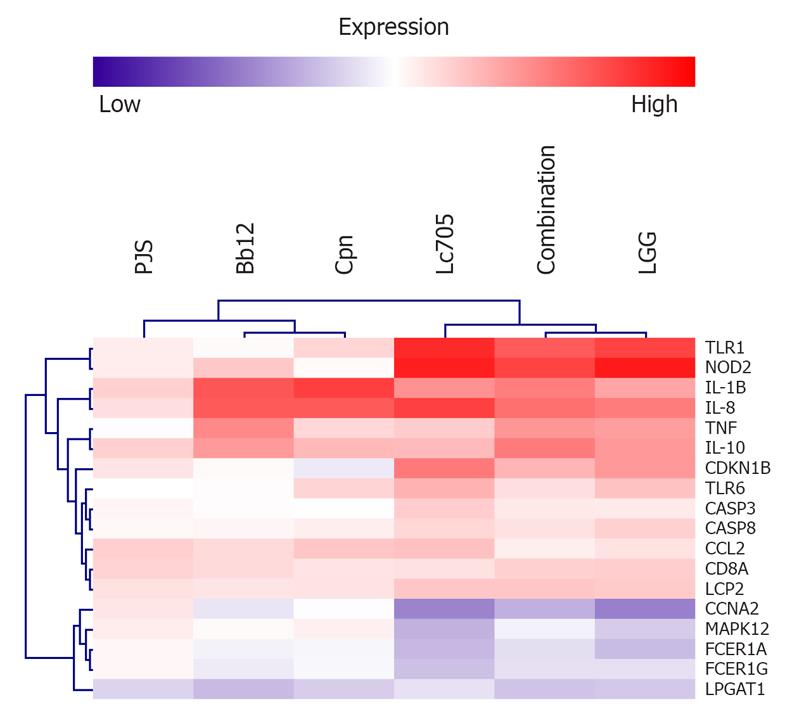
Figure 2 Two-way hierarchical clustering of representative genes selected from the functional category analysis (Table 1).
Data are average expression differences between unstimulated and bacteria-stimulated mast cells from three independent experiments at the 24-h time point. Analysis was performed using MeV software. PJS: Propionibacterium freudenreichii ssp. shermanii JS; Bb12: Bifidobacterium animalis ssp. lactis Bb12; Cpn: Chlamydia pneumoniae isolate Kajaani 6; Lc705: Lactobacillus rhamnosus Lc705; LGG: Lactobacillus rhamnosus GG; TLR1: Toll-Like receptor 1; NOD2: Nucleotide-binding oligomerization domain-containing protein 2; IL-1B: Interleukin-1β; IL-8: Interleukin-8; TNF: Tumor necrosis factor; IL-10: Interleukin-10; CDKN1B: Cyclin-dependent kinase inhibitor 1B; TLR6: Toll-Like receptor 6; CASP3: Caspase 3; CASP8: Caspase 8; CCL2: Chemokine (C-C motif) 2; CD8A: Cluster of differentiation 8 A (T cell surface glycoprotein); LCP2: Lymphocyte cytosolic protein 2; CCNA2: Cyclin A2; MAPK12: Mitogen-activated protein kinase 12; FCER1A: Fc fragment of IgE high affinity I receptor for α polypeptide; FCER1G: Fc fragment of IgE high affinity I receptor for γ polypeptide; LPGAT1: Lysophosphatidylglycerol acyltransferase 1.
-
Citation: Oksaharju A, Kankainen M, Kekkonen RA, Lindstedt KA, Kovanen PT, Korpela R, Miettinen M. Probiotic
Lactobacillus rhamnosus downregulatesFCER1 andHRH4 expression in human mast cells. World J Gastroenterol 2011; 17(6): 750-759 - URL: https://www.wjgnet.com/1007-9327/full/v17/i6/750.htm
- DOI: https://dx.doi.org/10.3748/wjg.v17.i6.750


