Copyright
©2011 Baishideng Publishing Group Co.
World J Gastroenterol. Feb 14, 2011; 17(6): 727-734
Published online Feb 14, 2011. doi: 10.3748/wjg.v17.i6.727
Published online Feb 14, 2011. doi: 10.3748/wjg.v17.i6.727
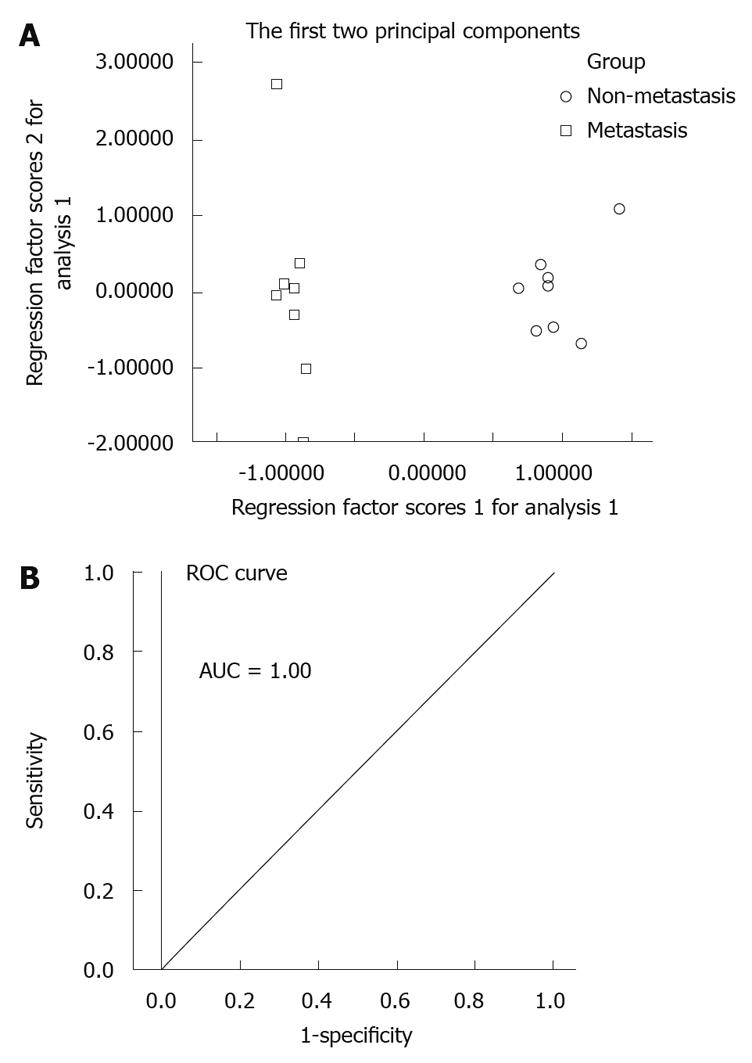
Figure 5 Principal component analysis model and receiver operating characteristic curve for gastric cancer metastasis.
A: Principal component analysis (PCA) scores plot of non-metastasis group and metastasis group based on 7 marker metabolites. The PCA scores plot showed the samples from non-metastasis group and metastasis group were scattered into two different regions; B: Receiver operating characteristic (ROC) analysis was performed using the values determined by the first two components. Area under the curve (AUC) = 1.00.
- Citation: Hu JD, Tang HQ, Zhang Q, Fan J, Hong J, Gu JZ, Chen JL. Prediction of gastric cancer metastasis through urinary metabolomic investigation using GC/MS. World J Gastroenterol 2011; 17(6): 727-734
- URL: https://www.wjgnet.com/1007-9327/full/v17/i6/727.htm
- DOI: https://dx.doi.org/10.3748/wjg.v17.i6.727


