Copyright
©2011 Baishideng Publishing Group Co.
World J Gastroenterol. Feb 14, 2011; 17(6): 727-734
Published online Feb 14, 2011. doi: 10.3748/wjg.v17.i6.727
Published online Feb 14, 2011. doi: 10.3748/wjg.v17.i6.727
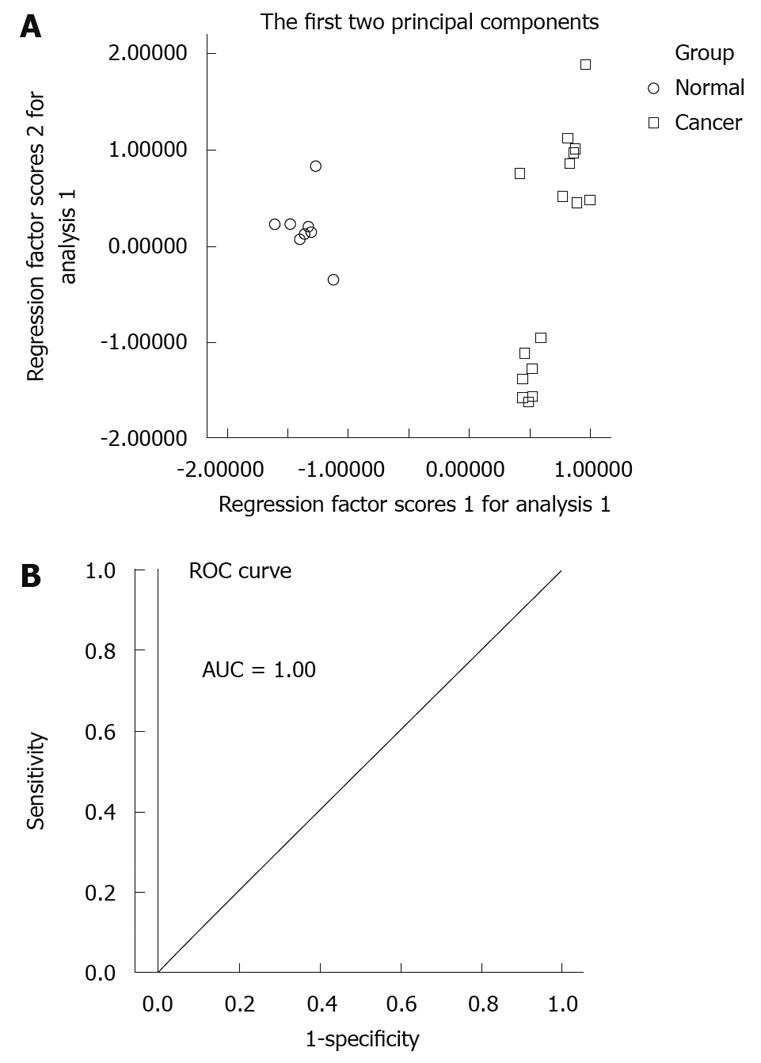
Figure 4 Principal component analysis model and receiver operating characteristic curve for gastric cancer.
A: Principal component analysis (PCA) scores plot of gastric tumor specimens from control specimens based on 10 marker metabolites. The PCA scores plot showed different samples (normal group, cancer group including non-metastasis group and metastasis group) were scattered into different regions; B: Receiver operating characteristic (ROC) analysis was performed using the values determined by the first two components. Area under the curve (AUC) = 1.00.
- Citation: Hu JD, Tang HQ, Zhang Q, Fan J, Hong J, Gu JZ, Chen JL. Prediction of gastric cancer metastasis through urinary metabolomic investigation using GC/MS. World J Gastroenterol 2011; 17(6): 727-734
- URL: https://www.wjgnet.com/1007-9327/full/v17/i6/727.htm
- DOI: https://dx.doi.org/10.3748/wjg.v17.i6.727


