Copyright
©2011 Baishideng Publishing Group Co.
World J Gastroenterol. Dec 14, 2011; 17(46): 5089-5096
Published online Dec 14, 2011. doi: 10.3748/wjg.v17.i46.5089
Published online Dec 14, 2011. doi: 10.3748/wjg.v17.i46.5089
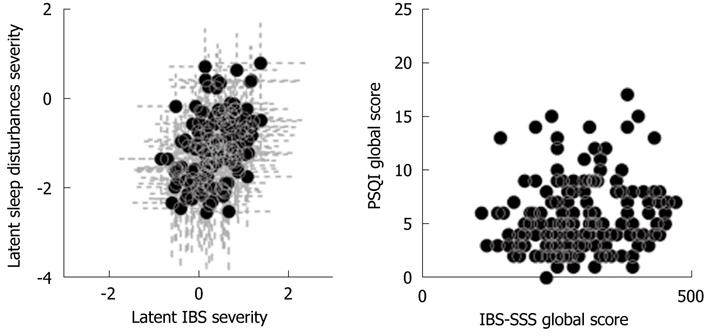
Figure 2 Scatter plot of the global Pittsburgh Sleep Quality Index score vs the global irritable bowel syndrome-Symptom Severity Score (left panel), and of sleep disturbances and irritable bowel syndrome latent severities (dots) (right panel).
The grey lines indicate the 95% CI. CI: Confidence interval.
- Citation: Bellini M, Gemignani A, Gambaccini D, Toti S, Menicucci D, Stasi C, Costa F, Mumolo MG, Ricchiuti A, Bedini R, Bortoli N, Marchi S. Evaluation of latent links between irritable bowel syndrome and sleep quality. World J Gastroenterol 2011; 17(46): 5089-5096
- URL: https://www.wjgnet.com/1007-9327/full/v17/i46/5089.htm
- DOI: https://dx.doi.org/10.3748/wjg.v17.i46.5089


