Copyright
©2011 Baishideng Publishing Group Co.
World J Gastroenterol. Aug 28, 2011; 17(32): 3739-3744
Published online Aug 28, 2011. doi: 10.3748/wjg.v17.i32.3739
Published online Aug 28, 2011. doi: 10.3748/wjg.v17.i32.3739
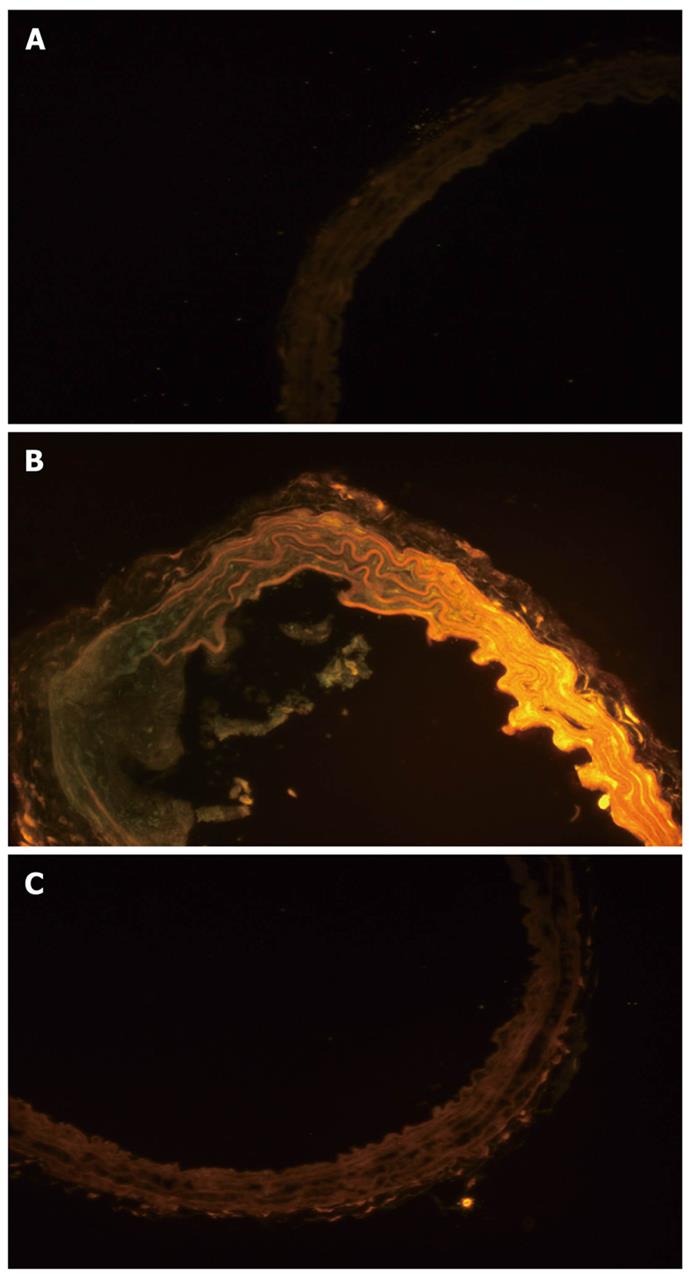
Figure 5 Nile red staining of an aorta from the three groups (× 100).
A: Nile red staining of an aorta from the control group; B: Nile red staining of an aorta from the high fat diet group; C: Nile red staining of an aorta from the sleeve gastrectomy group.
- Citation: Bai J, Wang Y, Liu Y, Geng DH, Liu JG. Sleeve gastrectomy prevents lipoprotein receptor-1 expression in aortas of obese rats. World J Gastroenterol 2011; 17(32): 3739-3744
- URL: https://www.wjgnet.com/1007-9327/full/v17/i32/3739.htm
- DOI: https://dx.doi.org/10.3748/wjg.v17.i32.3739


