Copyright
©2011 Baishideng Publishing Group Co.
World J Gastroenterol. Aug 21, 2011; 17(31): 3652-3658
Published online Aug 21, 2011. doi: 10.3748/wjg.v17.i31.3652
Published online Aug 21, 2011. doi: 10.3748/wjg.v17.i31.3652
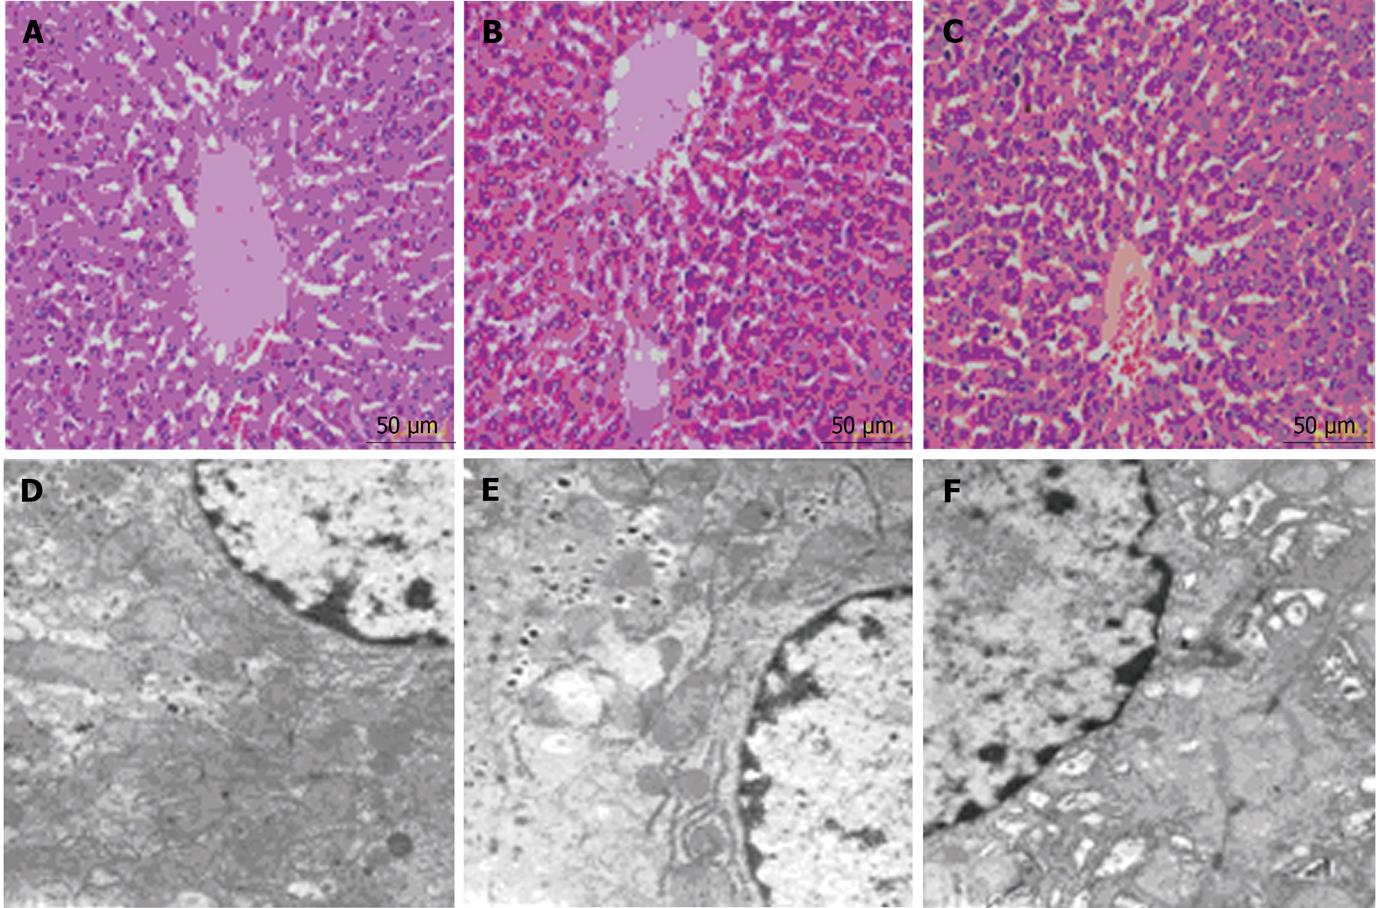
Figure 2 Histological changes in liver tissue.
A-C: Hematoxylin eosin observation;D-F: Transmission electron microscopic observation. A, D: The normal structure of hepatocytes and mitochondria in the control group; B, E: Mild hyperemia in liver tissue and mitochondrial swelling were observed in the 10 mmHg group. C, F: The hyperemia was more serious: Mitochondrial swelling and expanded rough endoplasmic reticulum were observed in the 15 mmHg group.
- Citation: Li J, Liu YH, Ye ZY, Liu HN, Ou S, Tian FZ. Two clinically relevant pressures of carbon dioxide pneumoperitoneum cause hepatic injury in a rabbit model. World J Gastroenterol 2011; 17(31): 3652-3658
- URL: https://www.wjgnet.com/1007-9327/full/v17/i31/3652.htm
- DOI: https://dx.doi.org/10.3748/wjg.v17.i31.3652


